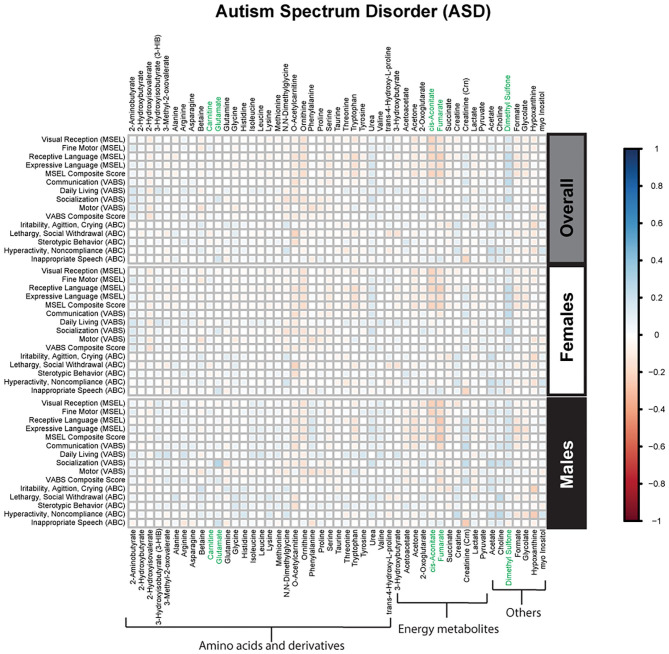
Figure 2.
Spearman correlation heatmap of psychometric scores and plasma metabolites for children with Autism Spectrum disorder (ASD) overall and stratified by sex. Positive associations (blue) identify metabolites where higher plasma concentrations correlated with improvement in psychometric scores, while negative associations (red) identify metabolites where higher plasma concentrations correlated with poorer neurodevelopmental or behavioral scores. For correlation analysis, the inverse scores of ABC subscales were used for ease of comparison with other MSEL and VABS scores. Metabolites that remained significant after FDR correction are shown in green.

