

Abstract
Introduction
Reference materials based on human cerebrospinal fluid were certified for the mass concentration of amyloid beta (Aβ)1‐42 (Aβ42). They are intended to be used to calibrate diagnostic assays for Aβ42.
Methods
The three certified reference materials (CRMs), ERM‐DA480/IFCC, ERM‐DA481/IFCC and ERM‐DA482/IFCC, were prepared at three concentration levels and characterized using isotope dilution mass spectrometry methods. Roche, EUROIMMUN, and Fujirebio used the three CRMs to re‐calibrate their immunoassays.
Results
The certified Aβ42 mass concentrations in ERM‐DA480/IFCC, ERM‐DA481/IFCC, and ERM‐DA482/IFCC are 0.45, 0.72, and 1.22 μg/L, respectively, with expanded uncertainties (k = 2) of 0.07, 0.11, and 0.18 μg/L, respectively. Before re‐calibration, a good correlation (Pearson's r > 0.97), yet large biases, were observed between results from different commercial assays. After re‐calibration the between‐assay bias was reduced to < 5%.
Discussion
The Aβ42 CRMs can ensure the equivalence of results between methods and across platforms for the measurement of Aβ42.
Keywords: Alzheimer's disease, amyloid beta peptide, certified reference material, commercial immunoassays
1. BACKGROUND
Early diagnosis and treatment of Alzheimer's disease (AD) continue to remain a challenge, mandating the need for biomarkers that reliably detect the underlying molecular pathology of the disease. Total tau (T‐tau) and phosphorylated tau (P‐tau) proteins as well as the 42 amino acid form of amyloid beta (Aβ) peptide, Aβ1‐42 (Aβ42) in cerebrospinal fluid (CSF) are widely accepted as the key biomarkers for AD. 1 A decrease of the Aβ42 concentration in CSF reflects its deposition into amyloid plaques in the brain, 2 , 3 , 4 and has consistently been shown to have a tight concordance with amyloid positron emission tomography. 5 , 6 A change in the Aβ42 concentration occurs in the very early stage of the disease, making this biomarker particularly suitable for early diagnosis. Currently, routine clinical measurement procedures are based on enzyme‐linked immunosorbent assays (ELISAs) or immunoassays using other detection approaches. However, there are large variations in the results obtained from equivalent samples using different diagnostic assays for AD biomarkers, as revealed by the quality control program of the Alzheimer's Association. 7 This is partially due to lack of standardization of these assays, 8 highlighting the need for reference measurement procedures (RMPs) 9 and certified reference materials (CRMs) for diagnostic biomarkers in AD. 10 , 11
The European Union Regulation on In vitro Diagnostic Medical Devices (Regulation [EU) 2017/746) requires traceability of property values carried by calibrators and control materials in RMPs and/or reference materials of higher order. The following requirements are necessary for a calibrator: the assigned value should be metrologically traceable and be accompanied by an uncertainty statement; the stability and homogeneity of the material should be verified against all the certified properties; and the material should be commutable, that is, sufficiently resembling the routine samples. 12 , 13
Therefore, in 2011 a working group for CSF proteins (WG‐CSF) was created by the International Federation of Clinical Chemistry and Laboratory Medicine (IFCC), for the purpose of developing CRMs and RMPs for international use. 11 As a first step, the WG‐CSF decided to focus on developing CRMs for the biomarker Aβ42 in CSF.
For the development of a reference system for Aβ42, it was important to assess the degree of correlation between results from different immunoassays for Aβ42. Importantly, two studies demonstrated good correlations among eight different assay methods 14 , 15 opening the possibility to make measurement results comparable through recalibration. As a follow‐up, the WG‐CSF focused on developing mass‐spectrometry‐based RMPs, 16 , 17 which were subsequently listed by the Joint Committee for Traceability in Laboratory Medicine (JCTLM) as higher order reference methods. A good correlation was observed a results obtained from seven immunoassays and the isotope dilution mass spectroscopy methods (IDMS). 18
After a commutability study that included immunoassays for Aβ42 from seven different manufacturers 14 and promising results from a ring trial using different IDMS methods later listed by JCTLM, between four laboratories, 19 the Joint Research Centre (JRC) was committed to the production of a CRM for Aβ42 in human CSF. The RMPs were used for the value assignment of CRMs for Aβ42.
Following the development of CRMs for Aβ42, three different vendors started using the three CRMs to re‐calibrate their Aβ42 test system. This article presents the development and certification of the CRMs and their implementation in the recalibration of commercial immunoassays from Roche Diagnostics (Penzberg, Germany), EUROIMMUN (Luebeck, Germany), and Fujirebio (Ghent, Belgium).
2. METHODS
2.1. Reference material development: raw materials
Human CSF was chosen as the starting material for the CRMs because the first commutability study showed that artificial matrices or CSF spiked with Aβ42 peptide were not commutable. 14 Freezing such liquid materials was shown to provide adequate stability in the previous studies. 20 The raw material was anonymized human CSF from samples provided by the Sahlgrenska Academy at the University of Gothenburg (Mölndal, Sweden). The CSF material was collected from 19 normal pressure hydrocephalus patients (first presenters) through continuous lumbar drainage and was approximately ranging from 200 to 350 mL per patient. This material was otherwise destined for destruction. Samples were aliquoted and frozen at –80°C at the respective Swedish neurological clinics where they were originally collected. Subsequently, the CSF samples were transported on dry ice to the Sahlgrenska Academy at the University of Gothenburg, where the sample's Aβ42 concentration was determined by ELISA (INNOTEST Amyloid β [1‐42], Fujirebio Europe N.V., Ghent, Belgium).
2.2. Reference material development: preparation and first studies of candidate materials
To process the candidate materials, the 19 CSF donations were thawed once. Three materials were prepared by pooling different Aβ42 level donations leading to ERM‐DA480/IFCC, ERM‐DA481/IFCC, and ERM‐DA482/IFCC with low, middle, and high concentration of CSF Aβ42, respectively. Subsequently, the CSF pools were aliquoted into 0.5 mL polypropylene Maxymum Recovery sterile microvials (Axygen Scientific, Inc., Union City, California, USA) and capped using screw caps with O‐rings. This was performed using an automatic filling/capping machine placed under a laminar flow cabinet equipped with high efficiency particulate air (HEPA) filters. Each pre‐labeled vial was filled with a minimum of 0.5 mL of CSF and stored immediately at –70°C. Detailed explanations on the processing are available in the certification report. 21
The assessment of the homogeneity of the processed material was crucial based on the outcome of several feasibility studies and the fact that Aβ42 is very prone to adhesion to surfaces. Homogeneity as well as short‐ and long‐term stability of the materials was assessed using immunoassays from Roche and EUROIMMUN. Furthermore, the candidate CRMs were tested in a commutability study and were commutable for the combination of routine measurement procedures such as EUROIMMUN beta‐amyloid (1‐42), IBL Amyloid‐beta (1‐42) CSF ELISA, INNOTEST β‐AMYLOID (1‐42), Lumipulse G β‐Amyloid (1‐42), V‐PLEX Aβ Peptide Panel 1 (6E10), and Roche Elecsys β‐amyloid (1‐42). 18
RESEARCH IN CONTEXT
Systematic review: Studies focusing on the commutability of certified reference materials (CRMs) for the harmonization of amyloid beta (Aβ)42 measurements were retrieved from PubMed.
Interpretation: The CRMs assist in procedure optimization and calibration. Our findings revealed that the bias across results obtained with assays from different manufacturers was reduced following re‐calibration of the procedures with the CRMs.
Future direction: We are one step closer to establishing a global cut‐off value for detecting Aβ42 and enabling its use in routine clinical diagnostics worldwide. A standardized pre‐analytical sample handling procedure would further help in generating comparable biomarker results. Furthermore, it is recommended to develop CRMs for other core AD biomarkers, including Aβ40 and tau, to facilitate accurate diagnosis of such neurodegenerative diseases.
2.3. Reference material development: value assignment using a common calibrant
A stock solution of pure recombinant Aβ42 peptide was prepared as the calibrant for the IDMS‐based RMPs. The peptide was processed based on the procedure described by Broersen et al. which showed the production of monomeric peptide in solution. 22 Recombinant human Aβ42 peptides were purchased deposited on lyophilized hexafluoroisopropanol (HFIP) films (rPeptide, Bogart, Georgia, USA) with a purity of ≥97%. The peptides were dissolved in HFIP at a concentration of 1 mg/mL, vortexed for 30 seconds, and dried with argon. Subsequently, the peptides were dissolved in dimethyl sulfoxide at a concentration of 1 mg/mL and vortexed for 30 seconds. This peptide solution was injected into a HiTrap desalting column (GE Healthcare Europe GmbH, Diegem, Belgium) equilibrated with 20% acetonitrile and 1% ammonium hydroxide in water. Fractions were collected, pooled, and diluted with 20% acetonitrile and 1% ammonium hydroxide. The peptide solution was collected in 0.5 mL polypropylene vials (Sarstedt, Nümbrecht, DE, Germany) with each vial containing 0.1 mL of solution. The vials were immediately stored at –70°C.
The value assignment of the calibrant stock solution was performed by IDMS using a TSQ Vantage mass spectrometer (Thermo Fisher Scientific, Waltham, Massachusetts, USA), with solid phase extraction and liquid chromatography conditions according to the RMP. 16 , 17 Six different Aβ42 preparations were used for the calibration of these measurements, producing six datasets for the stock solution. The concentration values of these six aforementioned Aβ42 preparations were determined by the JRC in Geel (Belgium) using amino acid analysis 21 based on IDMS 23 combined with the purity assessment of the peptide solutions. The content for the stock solution (the average of the means of the six datasets) was converted from mass fraction to mass concentration using the density of the stock solution. The resulting mass concentration for the calibrant stock solution was 68.87 ± 3.54 mg/L.
2.4. Reference material development: characterization and value assignment
The vials for the characterization of the material were selected using a random stratified sampling scheme and covered the whole processed batch. Depending on the amount of samples needed, the whole batch is cut into small sub‐batches and one sample is taken from the each of the sub‐batches. Then they are distributed among the studies to the various temperatures and time points.
A key requirement for any reference material aliquoted into units is equivalence between the units. This between‐unit homogeneity was evaluated to ensure that the certified values of the candidate CRMs are valid for all vials of the material, within the stated uncertainties. Therefore, the number of vials selected corresponds to at least the cube root of the total number of vials produced. The selected vials for homogeneity were analyzed both with a fully automated immunoassay (Roche Elecsys β‐amyloid [1‐42], Roche Diagnostics GmbH, Penzberg) 24 and with a manual ELISA (EUROIMMUN beta‐amyloid [1‐42], EUROIMMUN AG, Luebeck), 25 as described in the certification report. 21
Stability testing is necessary to establish the conditions for storage (long‐term stability), as well as for dispatch of the materials to the customer sites (short‐term stability). Time and temperature were regarded as the most relevant influences on the stability of the materials. The stability studies were carried out using an isochronous design. In this approach, samples are stored for a particular length of time at different temperature conditions. Subsequently, the samples are moved to conditions where further degradation can be assumed to be negligible or at least reduced (reference conditions). 26 , 27 At the end of the isochronous storage, the samples are analyzed simultaneously under repeatability conditions. For the short‐term stability study, samples were stored at –70°C, –20°C, 4°C, and 18°C, respectively, for 0, 1, 2, and 4 weeks (at each temperature). For the long‐term stability study, samples were stored at –70°C and –20°C for 0, 4, 8, and 12 months (at each temperature). In both case studies, the reference temperature was set to –150°C (stored above liquid nitrogen). Two vials per storage time were selected using a random stratified sampling scheme. From each vial, three subsamples were measured by ELISA (EUROIMMUN beta‐amyloid [1‐42], EUROIMMUN AG, Luebeck). The measurements were performed under repeatability conditions and a randomized sequence was used to differentiate any potential analytical drift from the trends over storage time as described in the certification report. 21
The candidate CRMs have been value‐assigned by IDMS using RMPs 16 , 17 or variations thereof. The IDMS measurements were calibrated using calibrators prepared from the common calibrant stock solution of Aβ42 as described above. Five laboratories were selected for the value‐assignment measurements based on criteria that comprised both demonstrated technical competence and quality management aspects. Prior to the study commencement, each participant was required to operate a quality system and to deliver documented evidence of their laboratory proficiency in the field of Aβ42 measurements in human CSF by successfully participating in a proficiency test. It was not mandatory to have an accreditation, but it was obligatory to meet the requirements of ISO/IEC 17025. 28
Each laboratory received nine vials each of ERM‐DA480/IFCC, ERM‐DA481/IFCC, and ERM‐DA482/IFCC and was requested to provide 27 independent results per candidate CRM, that is, three per vial. The sample preparations and measurements had to be spread over 3 days to ensure intermediate precision conditions. Each laboratory also received six vials of the Aβ42 stock solution to perform an independent calibration for each day of analysis.
2.5. Handling of the CRM
The following tests were conducted to determine a suitable way of handling the CRM samples. To determine the influence of the plastic surface on the analyte, the CRMs were analyzed using an ELISA (INNOTEST β‐AMYLOID [1‐42], Fujirebio) directly from their original vial as well as after transfer into a separate 1.5 mL polypropylene tube. The measurements were performed in triplicate for each of the three CRMs.
Additionally, this study determined the effect of different thawing methods on the measurement of Aβ42 in CSF pooled samples by ELISA. In total, 16 aliquoted CSF samples in tubes (1.5 mL vials, same reference as the ones used to store the CRMs) stored at –70°C were thawed in four different ways. First, all the vials were placed on the workbench to thaw for 15 minutes at room temperature in a standing position. Of the 16 vials, 4 vials did not receive any further treatment, while 4 other vials were tapped/flicked for five times. Another 4 vials were placed standing in an Eppendorf Thermomixer Comfort for 5 minutes at 300 rpm at room temperature and the remaining four vials were placed in a roller mixer (RotoShakeGenie) for 15 minutes at 30 rpm at room temperature. All the vials were measured by ELISA (INNOTEST β‐AMYLOID [1‐42], Fujirebio) in triplicate.
Another two tests were performed, first to determine the effect of keeping the CRMs at room temperature and then to determine the effect of successive freeze‐thaw cycles. To do so, each CRM level was analyzed at different time points (0, 4, 18, 24, and 48 hours) standing at room temperature for the first test and after 0, 1, 2, 3, and 5 successive freeze‐thaw cycles (from –70°C to room temperature for 25 minutes and re‐frozen at –70°C for 3.5 hours before re‐thawing). For both experiments, two vials per CRM per time point or per number of freeze‐thaw cycles were measured in triplicate. All the vials were measured by ELISA (INNOTEST β‐AMYLOID [1‐42], Fujirebio).
2.6. Recalibration: samples for immunoassay re‐calibration
Remnant de‐identified CSF samples were obtained from Winfried Stöcker's Klinisch‐immunologisches Labor (EUROIMMUN, Germany). The samples were tested for their Aβ42 levels using EUROIMMUN ELISA test. The samples were then pooled based on their Aβ42 concentrations to generate 15 CSF pools encompassing the entire Aβ42 measurement range. CSF pools were mixed and 250 μL were aliquoted per 2 mL screw‐cap micro Sarstedt tube (catalog number: 72.694.600) and stored at –20°C for ∼ 2 to 3 weeks before measurement. The tubes were pre‐rinsed with Aβ1‐40 dilution buffer (EUROIMMUN, Germany) to minimize Aβ42 binding to the tubes. 29
2.7. Recalibration: pre‐analytical handling and sample measurement for recalibration
All samples were sent to the manufacturers of immunoassays and analyzed according to their respective test instructions. The CRMs and the CSF pools were thawed on a roller mixer for 30 minutes at room temperature followed by a short spin down. Both the CRMs and CSF pools were transferred directly to the automation platforms without any transfer to alternative tubes. The automation platforms included the Lumipulse G series (Fujirebio, Belgium), Elecsys (Roche, Germany), and EUROIMMUN Chemiluminescence (ChLIA) RA 10 analyzer (EUROIMMUN, Germany). For each CSF pool, two aliquots were measured in total in duplicate on two separate days. On both days, the samples were loaded along with assay specific calibrators and controls without any change in the batch, operator, or instrument. The two different aliquots of the CRMs were measured at the beginning and at the end of each run in duplicates.
2.8. Recalibration: data analysis and statistics
This study was performed to determine bias between the platforms based on the concentrations calculated using original calibration curve and those re‐calibrated to the CRM values (CRM‐adjusted). Pairwise correlation between the assays was calculated using Pearson's, Spearman's, and Kendall's correlation coefficients. Regression analysis was used to estimate pairwise the bias between the assays: weighted Deming regression 30 was used for original values and Passing‐Bablok regression 31 for CRM‐adjusted values. In contrast to the weighted Deming regression, Passing‐Bablok regression is robust against outliers. Therefore, this method is often a preferable option for method comparison analysis. The currently implemented version of this regression assumes that the slope between methods should be close to one, which was expected for comparisons between CRM‐adjusted concentrations. For the comparisons of the original concentrations the expected slope was considerably different from one, therefore weighted Deming regression was used for the analysis. The regression fit Y = a + b X was used estimate expected percentage bias between two methods at median concentration M: (a + b M–M)/M × 100%. The 95% confidence intervals for weighted Deming regression fit were calculated using jackknife method. 30 For Passing‐Bablok regression, percentile bootstrap confidence intervals were used. 32 To reduce uncertainty of bias estimates due to random errors, the method comparisons were done based on the averaged measurements.
Precision of measurements (within‐run and between‐day variability) was investigated for each platform using variance component analysis.
Statistical calculations were conducted in R 3.2.2 using packages mcr 1.2.1 for regression analysis and VCA 1.2.1 for variance component analysis.
3. RESULTS
3.1. Reference material processing
Three reference materials with high, medium, and low concentrations of Aβ42 were prepared to allow vendors to establish calibration curves by mixing the three reference materials in different ratios. This was done to ensure that the dilution of the lower concentrations with the solvent did not result in non‐linearity of the calibration curve. For each concentration level, a set of CSF samples was mixed to produce a material with the targeted concentration and filled into pre‐labeled Axygen vials within a single day. On the day of the filling, the vials selected for homogeneity, stability, and characterization studies were removed and stored separately. All samples were frozen at –70°C on the day of processing.
3.2. Characterization of processed material
For the homogeneity studies, regression analysis was performed to evaluate potential trends in the analytical sequence as well as trends in the filling sequence. No trend in the filling sequence was observed at a 95% confidence level. Significant (95% confidence level) trends in the analytical sequence were visible and were corrected accordingly. Detailed explanations are available in the certification report. 21
For the stability studies, the data were evaluated individually for each temperature and the results were screened for outliers using the single and double Grubbs test at a confidence level of 99%. The short‐term stability study did not show any statistically significant trend for the candidate CRMs at –70°C or –20°C. A significant trend at 4°C was found for ERM‐DA481/IFCC, but not for ERM‐DA480/IFCC and ERM‐DA482/IFCC. Furthermore, a significant trend was observed for all three materials at 18°C. Therefore, it was concluded to ship the material on dry ice to avoid any freeze‐thaw cycles. In the long‐term stability study, none of the trends was statistically significant at a 99% confidence level for any of the temperatures, signifying that the material can be stored at –70°C. The complete stability results can be found in the certification report. 21
The value‐assignment measurements were performed by five laboratories using IDMS according to one of the RMPs or variations thereof. 16 , 17 The laboratories and their methods were previously validated in a ring trial. 19 As described in the certification report 21 the data were combined by calculating the unweighted average value of the means of five accepted datasets, wherein each set was obtained from a different laboratory (Figure 1). For each laboratory, the variations presented here are a combination of repeatability and day‐to‐day variation of the specific methods. The uncertainty is the expanded uncertainty of the certified value with a coverage factor k = 2 corresponding to a 95% confidence level. The certified Aβ42 mass concentrations in ERM‐DA480/IFCC, ERM‐DA481/IFCC, and ERM‐DA482/IFCC are 0.45, 0.72, and 1.22 μg/L, respectively, with expanded uncertainties (k = 2) of 0.07, 0.11, and 0.18 μg/L, respectively. Subsequently, the first CRMs for Aβ42 in CSF were released in December 2017 and are currently available to users for purchase. 33
FIGURE 1.
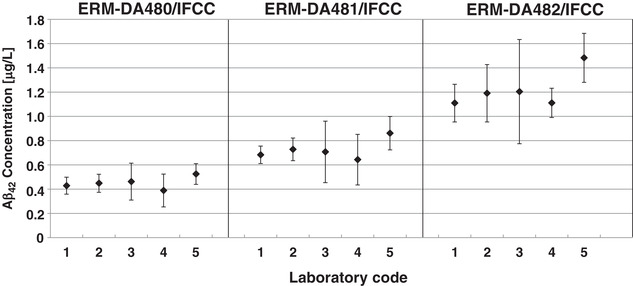
Results of the characterization measurements. Graph showing average amyloid beta (Aβ)42 concentrations in cerebrospinal fluid (CSF) in ERM‐DA480/IFCC, ERM‐DA481/IFCC, and ERM‐DA482/IFCC as measured with the reference measurement procedures. The bars represent the laboratory means ± 2 times the standard deviation
3.3. Handling of the CRM
Aβ42 is very prone to be adhesive to surfaces such as tubes and pipette tips. 29 , 34 Therefore, variability in the handling of the CRMs could lead to different results. 26 , 35 In the present study, an analysis of the three CRMs after their transfer into polypropylene tubes showed a decrease of measured values in comparison to an analysis directly from original CRM vials of ≈ 35%, 33%, and 20% for ERM‐DA480, ERM‐DA481, and ERM‐DA482, respectively (Figure 2A). After five successive tube transfers of ERM‐DA481, there was an ≈ 80% reduction in the original value (data not shown). These results portray the importance of handling the CRMs in the right manner, with an emphasis to avoid as much as possible tube/container transfers prior to analysis.
FIGURE 2.
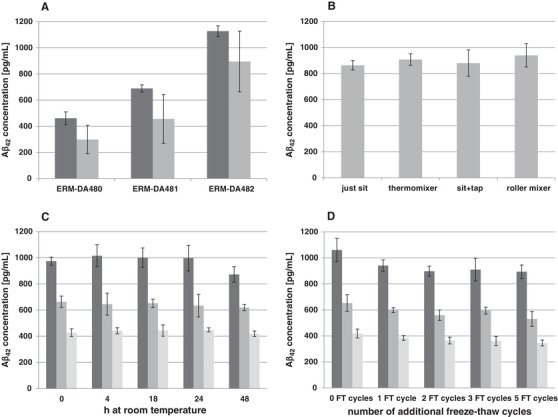
Handling of the certified reference materials (CRMs) cerebrospinal fluid (CSF). A, Graph showing average amyloid beta (Aβ)42 concentrations in ERM‐DA480/IFCC, ERM‐DA481/IFCC, and ERM‐DA482/IFCC before transfer (dark gray) and after transfer into an extra 1.5 mL polypropylene tube (gray) as measured by enzyme‐linked immunosorbent assays (ELISA; INNOTEST β‐AMYLOID [1‐42], Fujirebio). The bars represent the measurement means ± 2 times the standard deviation (95% confidence level). B, Graph showing the average Aβ42 concentration in a pooled CSF sample after four different thawing methods (room temperature sitting on the bench, homogenized by thermomixer, tap/flick five times, and on a roller mixer). The bars represent the measurement means ± 2 times the standard deviation (95% confidence level). C, Graph showing average Aβ42 concentrations in ERM‐DA480/IFCC (light gray), ERM‐DA481/IFCC (gray), and ERM‐DA482/IFCC (dark gray) at 0, 4, 18, 24, and 48 hours standing at room temperature. The bars represent the measurement means ± 2 times the standard deviation (95% confidence level). D, Graph showing average Aβ42 concentrations in ERM‐DA480/IFCC (light gray), ERM‐DA481/IFCC (gray), and ERM‐DA482/IFCC (dark gray) after 0, 1, 2, 3, and 5 freeze‐thaw cycles. The bars represent the measurement means ± 2 times the standard deviation (95% confidence level)
In addition, the methodology of thawing that includes contact between CSF and vial cap or rotation of vials for homogeneity etc. could have an influence on these materials. In the current study, even though some differences were observed among the four methods of thawing, the variation between the results was not > 8%, irrespective of the methodology used (Figure 2B). Furthermore, even though methods involving rotation such as roller mixing or thermo mixing gave slightly higher values by ELISA measurements, they were not statistically significant.
The time spent at room temperature and freeze‐thaw cycles of the CRMs were also investigated. Statistical evaluations were performed taking into account the conditions in which minimal change is expected as a reference point and then comparing the results applying the principles laid down. 36 In the present study we could observe that keeping the CRMs for several hours at room temperature does not seem to have a direct impact on the measurements (Figure 2C). However, at 48 hours the results for the highest CRM level (ERM‐DA482/IFCC) show a decrease of the Aβ42 concentration. This observed diminution is statistically significant when compared to time point t = 0. Therefore, we recommend using the CRMs shortly after thawing. Regarding the effect of possible freeze‐thaw cycles, we could see a statistically significant decrease in the measured values already after the first cycle (Figure 2D) and therefore we definitely recommend avoiding freeze‐thaw cycles of the materials.
3.4. Test system re‐calibration
EUROIMMUN, Roche, and Fujirebio used their respective assays to measure the Aβ42 concentration in the 15 CSF samples both before and after re‐calibration of their test system with the CRMs. A good overall precision of the measured values was observed across platforms. The variability among duplicate determinations was low for all assays (mean coefficient of variance < 5%) and no considerable run effects were observed (data not shown). The estimation of correlation and bias for the original sample concentrations revealed high correlations across the different platforms (R: 0.97 to 0.99; Figure 3A, B and C). However, a bias was observed at the median concentration across platforms with Roche versus EUROIMMUN at –25% (–28%, –21%), EUROIMMUN versus Fujirebio at 49% (46%, 52%), and Fujirebio versus Roche at –12% (–16%, –8%); Table 1). Following re‐calibration of the test system with the CRMs, a high consistency was observed among the measurement results without any significant bias across platforms at the median concentration of 700 pg/mL (Figure 4A, B and C). The bias observed at a fixed concentration of 700 pg/mL by comparing the platforms to the mean CRM‐adjusted concentrations was 1.16% (0.010%, 2.51%) for EUROIMMUN, 1.00% (–1.04%, 1.41%) for Fujirebio, and –2.06% (–3.15%, 1.97%) for Roche (Table 2). Overall, the deviations from the CRM target values were < 9% across platforms following re‐calibration (Figure 5).
FIGURE 3.
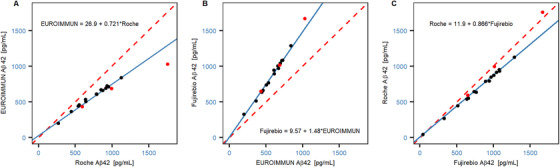
Correlation between platforms for original sample concentrations. Correlation and bias between the original concentrations were measured across platforms by comparing (A) EUROIMMUN versus Roche, (B) Fujirebio versus EUROIMMUN, and (C) Roche versus Fujirebio. The solid blue line represents the weighted Deming regression fit and the dashed red line indicates the identity. Symbols: certified reference materials (CRMs; red circles) and cerebrospinal fluid (CSF) pool (black circles)
TABLE 1.
Method comparisons between platforms (original concentrations): estimated regression coefficients and bias at the median concentration on the X‐axis
| X axis | Y axis | Pearson's r | Slope | Median concentration on X axis pg/mL | Bias at median concentration (CI) |
|---|---|---|---|---|---|
| Roche | EU | 0.97 | 0.72 (0.50, 0.94) | 787 | –25% (–28%, –21%) |
| EU | Fujirebio | 0.99 | 1.48 (1.15, 1.81) | 610 | 49% (46%, 52%) |
| Fujirebio | Roche | 0.98 | 0.87 (0.71, 1.02) | 918 | –12% (–16%, –8%) |
Abbreviation: EU, EUROIMMUN; CI, limits of 95% confidence interval.
FIGURE 4.

Comparison to the averaged certified reference materials (CRM)‐adjusted concentrations. Comparisons to the averaged CRM‐adjusted concentrations were made across platforms (A) EUROIMMUN, (B) Fujirebio, and (C) Roche. The solid blue line represents the Passing Bablok regression fit and the dashed red line indicates the identity. Symbols: CRMs (red circles) and cerebrospinal fluid (CSF) pool (black circles)
TABLE 2.
Comparison of CRM‐adjusted concentrations of each platform versus their average: estimated regression coefficients and bias at the rounded median concentration on the X‐axis (700 pg/mL)
| X axis | Y axis | Pearson's r | Slope | Bias at median concentration on X axis (CI) |
|---|---|---|---|---|
| Average | EU | 1.00 | 1.04 (0.981, 1.07) | 1.16% (0.010%, 2.51%) |
| Average | Fujirebio | 1.00 | 0.996 (0.944, 1.02) | 1.00% (–1.04%, 1.41%) |
| Average | Roche | 0.99 | 0.972 (0.948, 1.08) | –2.06% (–3.15%, 1.97%) |
Abbreviation: EU, EUROIMMUN; CI, limits of 95% confidence interval; CRM, certified reference materials.
FIGURE 5.

Average measurements of the certified reference materials (CRM) samples on the original and CRM‐adjusted scales. The blue solid (dashed) lines indicate the CRM target values (± 10%). Percentages coefficient of variation (CV) between the averaged measurements for each system are depicted in the upper part of the graph
4. DISCUSSION
4.1. Intended use
The CRMs ERM‐DA480/IFCC, ERM‐DA481/IFCC, and ERM‐DA482/IFCC are intended for the calibration of In Vitro Diagnostics, quality control, and/or the assessment of the method performance for the measurement of Aβ42 in CSF. Additionally, similar to any reference material, CRMs can be used for establishing control charts and in method validation studies.
The following sample handling recommendations are provided based on our experience studying the CRMs. First, the user should be aware that Aβ42 in CSF can aggregate and bind to surfaces, particularly to glass. The influence of surface on the analyte can be limited by keeping the number of tube transfers to a minimum, prior to measurement. Additionally, despite observing only limited effects due to the different thawing methods, we recommend avoiding vortexing or inverting the CRM vials to prevent contact between the solution and additional surface of the vial. Finally, storing the CRMs at room temperature for extended periods (> 24 hours) will have an impact on their stability. Therefore, it is important to thaw the CRM vials at room temperature and immediately use them for analysis. We recommend storing the materials at –70 ± 10°C and in the dark, avoiding direct sunlight exposure, and avoiding freeze‐thaw cycles.
The commutability of the reference materials was verified for the combination of the following routine measurement procedures which quantifies ether the full‐length of Aβ1‐42 or a mixture of AβN‐isoforms (eg, MSD): EUROIMMUN beta‐amyloid (1‐42) ELISA and ChLIA (EUROIMMUN AG, Luebeck, DE); IBL Amyloid‐beta (1‐42) CSF ELISA (IBL International GmbH, Hamburg, DE); INNOTEST β‐AMYLOID (1‐42) (Fujirebio Europe, N.V., Gent, BE); Lumipulse G β‐Amyloid (1‐42) (Fujirebio Europe N.V., Ghent, Belgium); V‐PLEX Aβ Peptide Panel 1 (6E10) (Meso Scale Discovery, LLC, Rockville, Maryland, USA); Roche Elecsys β‐amyloid (1‐42) (Roche Diagnostics GmbH). Furthermore, it is important that vendors with alternative Aβ42 measurement procedures, except those mentioned above, verify if the three CRMs or their dilutions are commutable for their methods.
The reference material can be obtained from the JRC or one of its authorized distributors. A detailed technical report is also available. 33
4.2. Immunoassays
With the introduction of various commercial new immunoassays, the specificity and sensitivity of Aβ42 detection in CSF samples has increased. 37 However, the variability observed in the measured Aβ42 concentration values across laboratories has precluded the usefulness of Aβ42 in routine clinical practice. 38 Such a variation has hindered the introduction of a common cut‐off value in the routine diagnostic work‐up for AD. Additionally, studies have reported that the apolipoprotein E (APOE) ε2/ε3/ε4 polymorphism affects the concentration of CSF Aβ42 in AD 39 , 40 and in turn impacts uniform cut‐off values. However, APOE ε4 genotype does not modulate CSF Aβ42 concentrations when stratified for cortical uptake of [18F] flutemetamol, indicating that the Aβ42 levels reveal cortical Aβ deposition independent of the APOE status. In short, all APOE genotypes should have a uniform clinical cut‐off value for CSF Aβ42 and these biomarkers correlate well with cerebral Aβ irrespective of APOE genotype. 41 Standardization of the pre‐analytical and analytical procedures would further aid in the generation of comparable results. 11 , 37 The Alzheimer's Association Global Biomarkers Standardization Consortium has been working to standardize pre‐analytical parameters such as the CSF sample collection as well as handling procedures. A consensus protocol for collection and analysis of fresh CSF sample for the estimation of Aβ42 was released during the Global Biomarkers Standardization Consortium meeting at the 2018 Alzheimer's Association International Conference held in Chicago. 42 , 43 In the current study, the CSF pools were mixed and aliquoted into 2 mL, protein low binding, polypropylene tubes as suggested in the above guidelines. These samples were then frozen at –20°C for subsequent analysis on the different automation platforms without any transfer to alternative tubes. Presently, there are no guidelines for handling frozen CSF samples for biomarker analysis. Therefore, there is an urgent need for "standard operating procedures" for frozen CSF samples including appropriate transport and storage guidelines. Standardization of the analytical procedures has been difficult due to the lack of calibrators with appropriately assigned target values. Therefore, without a reference system, the measurement of Aβ42 values is vendor dependent and results in a systematic bias of the estimated Aβ42 values across different platforms. 37 Consequently, the IFCC Working Group on CSF proteins developed reference methods for the quantification of Aβ42 in CSF. The IFCC and the JRC of the European Commission developed three CRMs from CSF pools with specified endogenous Aβ42 target concentrations. 11 , 21 All three CRMs were commutable across different vendor immunoassays for Aβ42.
In conclusion, it is possible to re‐calibrate CSF Aβ42 kits using the CRMs (ERM‐DA480/IFCC, ERM‐DA481/IFCC, and ERM‐DA482/IFCC) and to establish a quality control system for immunoassays. Subsequently, it is important for different vendors to re‐calibrate their test system using the CRMs, as mandated by the EU Directive on In Vitro Diagnostics Medical Devices (Directive 98/79/EC). We are now one step closer to the harmonization of different assays and the establishment of a global cut‐off value for CSF Aβ42 measurements in AD. As a follow‐up, the Global Biomarkers Standardization Consortium intends to organize a follow‐up study in the near future to confirm the findings in a larger cohort. The consortium will work to reach out to other kit manufacturers with an aim to implement the CRMs for test re‐calibration. Further work is currently ongoing to develop additional CRMs for other AD biomarkers including Aβ40, total‐tau, and phosphorylated‐tau.
CONFLICTS OF INTEREST
The authors state that there are no conflicts of interest regarding the publication of this article.
Boulo S, Kuhlmann J, Andreasson U, et al. First amyloid β1‐42 certified reference material for re‐calibrating commercial immunoassays. Alzheimer's Dement. 2020;16:1493–1503. 10.1002/alz.12145
REFERENCES
- 1. Blennow K, Hampel H, Weiner M, Zetterberg H. Cerebrospinal fluid and plasma biomarkers in Alzheimer disease. Nat Rev Neurol. 2010;6(3):131‐144. [DOI] [PubMed] [Google Scholar]
- 2. Strozyk D, Blennow K, White LR, Launer LJ. CSF Abeta 42 levels correlate with amyloid‐neuropathology in a population‐based autopsy study. Neurology. 2003;60(4):652‐656. [DOI] [PubMed] [Google Scholar]
- 3. Shaw LM, Vanderstichele H, Knapik‐Czajka M, et al. Cerebrospinal fluid biomarker signature in Alzheimer's disease neuroimaging initiative subjects. Ann Neurol. 2009;65(4):403‐413. [DOI] [PMC free article] [PubMed] [Google Scholar]
- 4. Seeburger JL, Holder DJ, Combrinck M, et al. Cerebrospinal fluid biomarkers distinguish postmortem‐confirmed Alzheimer's disease from other dementias and healthy controls in the OPTIMA cohort. J Alzheimers Dis. 2015;44(2):525‐539. [DOI] [PubMed] [Google Scholar]
- 5. Blennow K, Mattsson N, Scholl M, Hansson O, Zetterberg H. Amyloid biomarkers in Alzheimer's disease. Trends Pharmacol Sci. 2015;36(5):297‐309. [DOI] [PubMed] [Google Scholar]
- 6. Hansson O, Seibyl J, Stomrud E, et al. CSF biomarkers of Alzheimer's disease concord with amyloid‐β PET and predict clinical progression: a study of fully automated immunoassays in BioFINDER and ADNI cohorts. Alzheimers Dement. 2018;14(11):1470‐1481. [DOI] [PMC free article] [PubMed] [Google Scholar]
- 7. Mattsson N, Andreasson U, Persson S, et al. CSF biomarker variability in the Alzheimer's Association quality control program. Alzheimers Dement. 2013;9(3):251‐261. [DOI] [PMC free article] [PubMed] [Google Scholar]
- 8. Schimmel H, Zegers I, Emons H. Standardization of protein biomarker measurements: is it feasible?. Scand J Clin Lab Invest Suppl. 2010;242:27‐33. [DOI] [PubMed] [Google Scholar]
- 9. Mattsson N, Zegers I, Andreasson U, et al. Reference measurement procedures for Alzheimer's disease cerebrospinal fluid biomarkers: definitions and approaches with focus on amyloid β42. Biomark Med. 2012;6(4):409‐417. [DOI] [PubMed] [Google Scholar]
- 10. Schimmel H, Zegers I. Performance criteria for reference measurement procedures and reference materials. Clin Chem Lab Med. 2015;53(6):899‐904. [DOI] [PubMed] [Google Scholar]
- 11. Kuhlmann J, Andreasson U, Pannee J, et al. CSF Aβ1‐42—an excellent but complicated Alzheimer's biomarker—a route to standardisation. Clin Chim Acta. 2017;467:27‐33. [DOI] [PubMed] [Google Scholar]
- 12. ISO 17034 , General requirements for the competence of reference material producers. 2016. ISO, Geneva.
- 13. ISO Guide 35 , Reference materials—‐guidance for characterization and assessment of homogeneity and stability. 2017. ISO, Geneva.
- 14. Bjerke M, Andreasson U, Kuhlmann J, et al. Assessing the commutability of reference material formats for the harmonization of amyloid‐β measurements. Clin Chem Lab Med. 2016;54(7):1177‐1191. [DOI] [PubMed] [Google Scholar]
- 15. Vanderstichele HM, Shaw L, Vandijck M, et al. Alzheimer disease biomarker testing in cerebrospinal fluid: a method to harmonize assay platforms in the absence of an absolute reference standard. Clin Chem. 2013;59(4):710‐712. [DOI] [PubMed] [Google Scholar]
- 16. Leinenbach A, Pannee J, Dulffer T, et al. Mass spectrometry‐based candidate reference measurement procedure for quantification of amyloid‐β in cerebrospinal fluid. Clin Chem. 2014;60(7):987‐994. [DOI] [PubMed] [Google Scholar]
- 17. Korecka M, Waligorska T, Figurski M, et al. Qualification of a surrogate matrix‐based absolute quantification method for amyloid‐β42 in human cerebrospinal fluid using 2D UPLC‐tandem mass spectrometry. J Alzheimers Dis. 2014;41(2):441‐451. [DOI] [PMC free article] [PubMed] [Google Scholar]
- 18. Andreasson U, Kuhlmann J, Pannee J, et al. Commutability of the certified reference materials for the standardization of β‐amyloid 1‐42 assay in human cerebrospinal fluid: lessons for tau and β‐amyloid 1‐40 measurements. Clin Chem Lab Med. 2018;56(12):2058‐2066. [DOI] [PubMed] [Google Scholar]
- 19. Pannee J, Gobom J, Shaw LM, et al. Round robin test on quantification of amyloid‐β 1‐42 in cerebrospinal fluid by mass spectrometry. Alzheimers Dement. 2016;12(1):55‐59. [DOI] [PubMed] [Google Scholar]
- 20. Bjerke M, Portelius E, Minthon L, et al. Confounding factors influencing amyloid beta concentration in cerebrospinal fluid. Int J Alzheimers Dis. 2010;2010:986310. [DOI] [PMC free article] [PubMed] [Google Scholar]
- 21. Kuhlmann J, Boulo S, Andreasson U, et al. The certification of amyloid β1‐42 in CSF in ERM®‐DA480/IFCC, ERM®‐DA481/IFCC and ERM®‐DA482/IFCC. Publications Office of the EU. 2017.
- 22. Broersen K, Jonckheere W, Rozenski J, et al. A standardized and biocompatible preparation of aggregate‐free amyloid beta peptide for biophysical and biological studies of Alzheimer's disease. Protein Eng Des Sel. 2011;24(9):743‐750. [DOI] [PubMed] [Google Scholar]
- 23. Munoz A, Kral R, Schimmel H. Quantification of protein calibrants by amino acid analysis using isotope dilution mass spectrometry. Anal Biochem. 2011;408(1):124‐131. [DOI] [PubMed] [Google Scholar]
- 24. Bittner T, Zetterberg H, Teunissen CE, et al. Technical performance of a novel, fully automated electrochemiluminescence immunoassay for the quantitation of β‐amyloid (1‐42) in human cerebrospinal fluid. Alzheimers Dement. 2016;12(5):517‐526. [DOI] [PubMed] [Google Scholar]
- 25. Sutphen CL, Jasielec MS, Shah AR, et al. Longitudinal cerebrospinal fluid biomarker changes in preclinical alzheimer disease during middle age. JAMA Neurol. 2015;72(9):1029‐1042. [DOI] [PMC free article] [PubMed] [Google Scholar]
- 26. Zimmermann R, Lelental N, Ganslandt O, Maler JM, Kornhuber J, Lewczuk P. Preanalytical sample handling and sample stability testing for the neurochemical dementia diagnostics. J Alzheimers Dis. 2011;25(4):739‐745. [DOI] [PubMed] [Google Scholar]
- 27. Le Bastard N, De Deyn PP, Engelborghs S. Importance and impact of preanalytical variables on Alzheimer disease biomarker concentrations in cerebrospinal fluid. Clin Chem. 2015;61(5):734‐743. [DOI] [PubMed] [Google Scholar]
- 28. ISO/IEC 17025 , General requirements for the competence of testing and calibration laboratories. 2017. ISO, Geneva.
- 29. Vanderstichele HM, Janelidze S, Demeyer L, et al. Optimized standard operating procedures for the analysis of cerebrospinal fluid aβ42 and the ratios of aβ isoforms using low protein binding tubes. J Alzheimers Dis. 2016;53(3):1121‐1132. [DOI] [PMC free article] [PubMed] [Google Scholar]
- 30. Linnet K. Evaluation of regression procedures for methods comparison studies. Clin Chem. 1993;39(3):424‐432. [PubMed] [Google Scholar]
- 31. Passing H. Bablok. A new biometrical procedure for testing the equality of measurements from two different analytical methods. Application of linear regression procedures for method comparison studies in clinical chemistry, Part I. J Clin Chem Clin Biochem. 1983;21(11):709‐720. [DOI] [PubMed] [Google Scholar]
- 32. Efron B, Tibshirani RJ. An Introduction to the Bootstrap. Boca Raton, London, New York, Washington, DC: Chapman and Hall/CRC; 1993. [Google Scholar]
- 33. Certified Reference Materials catalogue of the JRC. https://crm.jrc.ec.europa.eu/.
- 34. Toombs J, Paterson RW, Schott JM, Zetterberg H. Amyloid‐beta 42 adsorption following serial tube transfer. Alzheimers Res Ther. 2014;6(1):5. [DOI] [PMC free article] [PubMed] [Google Scholar]
- 35. Willemse E, van Uffelen K, Brix B, Engelborghs S, Vanderstichele H, Teunissen C. How to handle adsorption of cerebrospinal fluid amyloid β (1‐42) in laboratory practice? Identifying problematic handlings and resolving the issue by use of the Aβ42/Aβ40 ratio. Alzheimers Dement. 2017;13(8):885‐892. [DOI] [PubMed] [Google Scholar]
- 36. Linsinger T, Comparison of a measurement result with the certified value. ERM application note 1, European Commission, Brussels in 2010.
- 37. Andreasson U, Bjerke M, Pannee J, Portelius E, Zetterberg H, Blennow K. Commutability of candidate reference materials for the harmonization of Aβ1‐42 measurements, on behalf of the ifcc working group on CSF proteins. Alzheimers Dement. 2015;11(7):P868‐P869. [Google Scholar]
- 38. Verwey NA, van der Flier WM, Blennow K, et al. A worldwide multicentre comparison of assays for cerebrospinal fluid biomarkers in Alzheimer's disease. Ann Clin Biochem. 2009;46(Pt 3):235‐240. [DOI] [PubMed] [Google Scholar]
- 39. Lautner R, Insel PS, Skillback T, et al. Preclinical effects of APOE ε4 on cerebrospinal fluid Aβ42 concentrations. Alzheimers Res Ther. 2017;9(1):87. [DOI] [PMC free article] [PubMed] [Google Scholar]
- 40. Mattsson N, Eriksson O, Lindberg O, et al. Effects of APOE ε4 on neuroimaging, cerebrospinal fluid biomarkers, and cognition in prodromal Alzheimer's disease. Neurobiol Aging. 2018;71:81‐90. [DOI] [PubMed] [Google Scholar]
- 41. Lautner R, Palmqvist S, Mattsson N, et al. Apolipoprotein E genotype and the diagnostic accuracy of cerebrospinal fluid biomarkers for Alzheimer disease. JAMA Psychiatry. 2014;71(10):1183‐1191. [DOI] [PubMed] [Google Scholar]
- 42. Association As. GBSC Working Groups, Available At: https://www.alz.org/research/for_researchers/partnerships/gbsc.
- 43. Janelidze S, Stomrud E, Brix B, Hansson O. Towards a unified protocol for handling of CSF before β‐amyloid measurements. Alzheimers Res Ther. 2019;11(1):63. [DOI] [PMC free article] [PubMed] [Google Scholar]