

Abstract
Introduction
This study investigated the diagnostic and disease‐monitoring potential of plasma biomarkers in mild cognitive impairment (MCI) and Alzheimer's disease (AD) dementia and cognitively unimpaired (CU) individuals.
Methods
Plasma was analyzed using Simoa assays from 99 CU, 107 MCI, and 103 AD dementia participants.
Results
Phosphorylated‐tau181 (P‐tau181), neurofilament light, amyloid‐β (Aβ42/40), Total‐tau and Glial fibrillary acidic protein were altered in AD dementia but P‐tau181 significantly outperformed all biomarkers in differentiating AD dementia from CU (area under the curve [AUC] = 0.91). P‐tau181 was increased in MCI converters compared to non‐converters. Higher P‐tau181 was associated with steeper cognitive decline and gray matter loss in temporal regions. Longitudinal change of P‐tau181 was strongly associated with gray matter loss in the full sample and with Aβ measures in CU individuals.
Discussion
P‐tau181 detected AD at MCI and dementia stages and was strongly associated with cognitive decline and gray matter loss. These findings highlight the potential value of plasma P‐tau181 as a non‐invasive and cost‐effective diagnostic and prognostic biomarker in AD.
Keywords: Alzheimer's disease, magnetic resonance imaging, phosphorylated tau, plasma biomarkers
1. INTRODUCTION
Alzheimer's disease (AD) has until recently been diagnosed based solely on clinical symptomatology, with definitive neuropathological confirmation at post‐mortem. Using cerebrospinal fluid (CSF) and positron emission tomography (PET)−based biomarkers, however, amyloid beta (Aβ) and tau pathology,1, 2 the pathological hallmarks of AD, can now be measured in vivo. These biomarkers are now considered to provide supportive evidence for AD in recent diagnostic criteria and have helped to refine the biological definition of the disease.3, 4, 5 Owing to the perceived invasiveness of lumbar punctures for CSF and the high cost of PET imaging, neither technique is suitable for widespread use in a primary care settings, where the majority of dementia diagnoses are made. Both techniques, however, have greatly guided the rapid discovery and validation of blood biomarkers for AD pathology, measured by ultra‐sensitive immunoassays or mass spectrometry methods. Recent studies have shown plasma measures to relate to Aβ deposition,6, 7, 8 astrogliosis9 and neurodegeneration.10, 11, 12, 13 Tau phosphorylated at threonine181 (P‐tau181) may be the most clinically meaningful plasma biomarker in AD to date, and multiple studies performed in independent cohorts demonstrate its high specificity for AD, strong associations with Aβ and tau PET, and high accuracy for predicting progression from mild cognitive impairment (MCI) to AD dementia.14, 15, 16, 17, 18, 19
It is expected that blood biomarkers will advance the diagnostic workup of individuals with cognitive complaints, early onset dementia, and atypical dementia presentations. By rapid indication of the underlying pathology, blood biomarkers will permit for more informed patient management and symptomatic treatment. Still, more evidence is needed to demonstrate the validity of blood biomarkers in clinical cohorts that more closely resemble those from primary care settings (eg, not predefined by in vivo measures). In the present study, we tested the diagnostic and prognostic performance of putative blood biomarkers of AD pathology (Aβ42, Aβ42/Aβ40, total [T‐tau], and P‐tau181), axonal injury (neurofilament light [NfL]), and astrogliosis (glial fibrillary acidic protein [GFAp]), which included their baseline and longitudinal association with cognitive decline and grey matter (GM) atrophy in the clinical AddNeuroMed cohort.
2. METHODS
2.1. Participants
We included 309 participants from the AddNeuroMed study,20, 21 which is a public‐private partnership initiated to discover plasma biomarkers of AD for use in clinical trials, including cognitively unimpaired (CU) participants and patients with MCI (including a subset which progressed to AD dementia, n = 19), and individuals with AD dementia. The participants in this study were selected based on the availability of both plasma samples and magnetic resonance imaging (MRI) imaging. All patients were recruited from local memory clinics at participating sites (University of Kuopio, Finland; University of Perugia, Italy; Aristotle University of Thessaloniki, Greece; King's College London, United Kingdom; University of Lodz, Poland; and University of Toulouse, France), whereas CU participants were recruited from non‐related members of the patient's families, caregiver's relatives, or social centers for the elderly. The diagnosis of probable AD was made according to Diagnostic and Statistical Manual of Mental Disorders, Fourth Edition, (DSM‐IV) and National Institute of Neurological, Communicative Disorders and Stroke–Alzheimer's Disease and Related Disorders Association (NINCDS‐ADRDA) criteria.22 MCI was defined according to the Petersen criteria.23 Conversion from MCI‐AD was defined as fulfilling MCI criteria at baseline, but at a later visit meeting the criteria for probable AD dementia. Patients were excluded if they had significant psychiatric or unstable somatic illness. Further information on study design, enrollment, and inclusion and exclusion criteria have been described elsewhere20, 24 and is further described in the Supplement. All participants gave written informed consent, with the study approved by local ethical review boards in each participating country.
2.2. MRI acquisition and processing
T1‐weighted structural MR images (baseline, 3 and 12 months) were acquired using a sagittal 3D magnetization‐prepared rapid gradient‐echo (MP‐RAGE) sequence, using six different 1.5T MR systems (four General Electric [General Electric Healthcare, Milwaukee, WI]; one Siemens [Siemens Medical Solutions, Erlangen, Germany]; and one Picker [General Electric Healthcare]). All data were preprocessed through the HiveDB database system.25 Full MRI details are described elsewhere.24
RESEARCH IN CONTEXT
Systematic review: The authors reviewed the available scientific literature on PubMed for articles examining plasma biomarkers in Alzheimer's disease (AD). Recent publications report diagnostic performance of individual plasma biomarkers, but no head‐to‐head studies comparing the diagnostic performance and prediction of disease progression between the major putative plasma biomarkers. Therefore, in this study, we compare their diagnostic performance, their longitudinal trajectories, and how they predict cognitive decline and gray matter (GM) loss.
Interpretation: Our findings suggest that one of these biomarkers is superior—plasma tau phosphorylated at threonine181 (P‐tau181) accurately detected AD at the dementia and mild cognitive impairment (MCI) stages and was more strongly associated with cognitive decline and GM loss compared to other plasma biomarkers. These findings highlight the potential value of plasma P‐tau181 as a non‐invasive and cost‐effective diagnostic and prognostic biomarker in AD.
Future directions: Further validation studies will be needed if these biomarkers are to be incorporated into clinical practice. This includes implementing cut‐offs and harmonizing inter‐laboratory handling.
2.3. Voxel‐based morphometry
After intensity nonuniformity correction,26 anatomical images were segmented into probabilistic GM, white matter (WM), and CSF.26, 27 Voxel‐based morphometry (VBM)28 was then performed on the structural segmented GM images, nonlinearly resampled to the MNI‐152 template, and smoothed with a Gaussian kernel of full width at half maximum (FWHM) of 8 mm.
2.4. Biochemical analyses
At the time of assessment, all blood samples were drawn by venipuncture and collected into ethylenediaminetetraacetic acid (EDTA) tubes. Participants were required to fast for at least 2 hours prior to collection. All samples were centrifuged at 2000 g for 10 min at 4°C. Plasma supernatant was collected, divided into aliquots, and then frozen at −80°C until further use.29 Plasma analysis were performed on an HD‐1 analyzer (Quanterix, Lexington, MA) at the Department of Psychiatry and Neurochemistry, University of Gothenburg between May and August 2019. Commercially available Simoa assays were used to quantify GFAp, Aβ42, Aβ40, and T‐tau (GFAP Discovery, #102336 and Advantage Neuro 3‐plex, #101995). In‐house Simoa assays were used to quantify NfL30 and P‐tau181.17 More detailed information on plasma biomarker assay performance is provided in Table S1.
2.5. Cognition
Global cognition was assessed using longitudinal Mini‐Mental State Examination (MMSE), tested at an average [median] of 4 time points (interquartile range [IQR] 3–5], with data extending up to 4 years (average years 2.4, ± 0.9 years).
2.6. Statistical analyses
Demographic, clinical, and plasma biomarker findings were compared between groups using Kruskal‐Wallis, Mann‐Whitney, or Fisher exact tests. Diagnostic accuracy of plasma markers was assessed using age‐adjusted area‐under‐the‐curve (AUC) values from receiver‐operating characteristic (ROC) analyses (AD dementia vs CU and MCI; MCI vs CU; MCI converters vs non‐converters; and MCI converters vs CU). Differences in AUCs were evaluated using bootstrapping (n = 1000).31, 32, 33 In a second step, we compared the best‐performing plasma biomarker (based on AUC) to a model incorporating all plasma biomarkers using logistic regression for each of the five contrasts used in the ROC analyses. Models were then compared using the Akaike information criterion (AIC),34, 35 where a difference of ≥2 points indicates a better model fit. Linear mixed‐effects (LME) models were used to assess (1) change in plasma measures over time and (2) the association between plasma measures at baseline and cognition (MMSE). These had subject‐specific intercepts and slopes and included the interaction between (continuous) time and plasma measures as predictors (adjusted for age, sex, education, and apolipoprotein E (APOE) ε4 genotype). We also evaluated interactions between plasma predictors and diagnosis; when significant, we performed subgroup analyses within diagnostic groups. These analyses were performed in R (v4.0.0; significance set at P < 0.05, two‐sided).
For voxelwise analyses (plasma predictors with GM volume as the response variable), the same LME models as described earlier were also implemented at the voxel level using VoxelStats,36 with findings corrected for multiple comparisons using random field theory (RFT),37 P < 0.05).
3. RESULTS
3.1. Participants
Three hundred nine participants were included: 99 CU controls, 107 MCI (19 who converted to AD dementia at the second visit [12 months (±1.3)] and 88 non‐converters), and 103 AD dementia patients. Baseline characteristics are summarized in Table 1. Information on follow‐up timepoints can be found in Tables S2 and S3. Information on plasma biomarkers and participant characteristics can be found in the Supplementary results.
TABLE 1.
Baseline demographics and clinical characteristics
| MCI | ||||||
|---|---|---|---|---|---|---|
| Characteristic | CU | Total | Converters | Non‐converters | AD | P‐value |
| No. | 99 | 107 | 19 | 88 | 103 | |
| Age, years (SD) | 73 (6.14)† | 74.47 (5.89) | 73.21 (6.62) | 74.74 (5.73) | 76.35 (5.76) | <.001 |
| Sex, female/male (% females) | 53/46 (53.5) | 56/51 (52.2) | 8/11 (42.1) | 48/40 (54.5) | 63/40 (61.2) | .370 |
| Education, years (SD) | 11.23 (4.8)† ‡ | 8.97 (4.28) | 9.26 (4.81) | 8.91 (4.18) | 7.82 (3.66) | <.001 |
| APOE ε4 status, pos./neg. (% pos.) | 31/68 (31.3)† | 39/68 (36.4)† | 12/6 (66.7) | 56/27 (32.5) | 58/45 (56.3) | <.01 |
| MMSE score, mean (SD) | 29.07 (1.26)‡ † | 27.21 (1.82)† | 26.58 (2.06) | 27.34 (1.75) | 21.07 (4.42) | <.001 |
| CDR score, mean (SD) | 0.04 (0.13)‡ † | 0.50 (0.07)† | 0.53 (0.11) | 0.49 (0.05) | 1.05 (0.51) | <.001 |
| P‐tau181, mean (pg/mL) (SD) | 8.85 (4.48)‡ † | 13.13 (6.21)† | 17.13 (6.19)§ | 12.26 (5.89) | 19.43 (7.57) | <.001 |
| NfL, mean (pg/mL) (SD) | 18.35 (8.68)†‡ | 25.96 (15.56)† | 26.51 (9.26) | 25.84 (16.65) | 32.47 (15.29) | <.001 |
| Aβ42, mean (pg/mL) (SD) | 10.07 (2.71) | 10.31 (2.52) | 10.67 (3.12) | 10.24 (2.42) | 9.43 (2.91) | <.05 |
| Aβ42/Aβ40, mean (SD) | 0.037 (0.006)† | 0.036 (0.006)† | 0.035 (0.004) | 0.037 (0.006) | 0.032 (0.008) | <.001 |
| T‐tau, mean (pg/mL) (SD) | 2.36 (1.07)† | 2.69 (1.08)† | 2.97 (0.93) | 2.64 (1.10) | 3.21 (2.48) | <.001 |
| GFAp, mean (pg/mL) (SD) | 125.23 (73.76)† | 147.81 (81.14)† | 176.46 (107.2) | 143.84 (77.24) | 219.04 (136.1) | <.001 |
Abbreviations: AD, AD dementia; CDR, cognitive dementia rating scale; CU, cognitively unimpaired. Data are given as mean (SD). Demographic factors and clinical characteristics were assessed using Fisher exact test across the whole group, and then to compare between two groups. Kruskal‐Wallis test was used to assess continuous variables (MCI, CU, and AD), and Mann‐Whitney test (MCI converters vs MCI non‐converters). Significant differences in plasma biomarker concentrations are after accounting for the effects of age, educational level, APOE ε4 status, and sex.; GFAp, glial fibrillary acidic protein; MCI, mild cognitive impairment; MMSE, Mini‐Mental State Examination; NfL, neurofilament light; P‐tau181, phosphorylated tau 181; T‐tau, total tau; Aβ42/40, amyloid‐β42/40.
† = significantly different from AD, P < 0.05; ‡ = significantly different from MCI, P < 0.05. Significantly different from MCI non‐converters, P < 0.05 = § (only comparing with MCI converters).
3.2. Biomarker concentrations across diagnostic groups
At baseline, group comparison revealed increased levels of P‐tau181, NfL, T‐tau, and GFAp (P < 0.001), and decreased Aβ42/Aβ40 (P < 0.001)—but not Aβ42—in AD dementia compared with CU (Figure 1A). Significant differences were also observed between AD dementia and MCI for P‐tau181, NfL, T‐tau, Aβ42/Aβ40 (P < 0.001), and GFAp (P < 0.01). Only P‐tau181 and NfL were shown to be increased in MCI compared with CU (P < 0.001). In addition, MCI patients who later converted to AD had significantly higher baseline concentrations of plasma P‐tau181 than MCI patients with a stable disease state (P < 0.001) (Table 1, Figure 1B). This was not observed for any other plasma biomarker.
FIGURE 1.
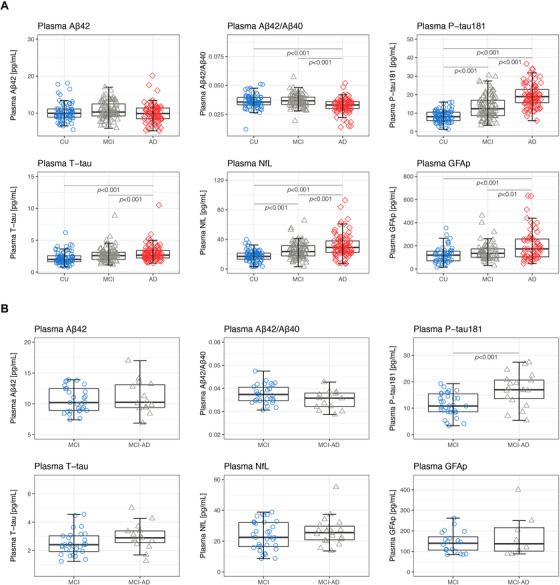
Baseline comparisons of plasma biomarker concentrations across groups. (A) Plasma concentrations of P‐tau181, NfL, Aβ42, Aβ42/Aβ40, T‐tau, and GFAp are shown for CU, MCI, and AD (B) Plasma concentrations of P‐tau181, NfL, Aβ42, Aβ42/Aβ40, T‐tau, and GFAp are shown for MCI and MCI‐AD patients. Abbreviations: Aβ42/40, amyloid‐β42/40; AD, Alzheimer's disease; CU, cognitively unimpaired; GFAp; glial fibrillary acidic protein; MCI, mild cognitive impairment; NfL, neurofilament light; P‐tau181, phosphorylated tau 181; T‐tau, total tau. MCI = patients who did not progress to any type of dementia; MCI‐AD = patients who progressed to AD dementia. All P values are derived from a univariate linear model, adjusted for the effects of age, sex, APOE ε4 status, and education
3.3. Comparative diagnostic performance of plasma biomarkers
ROC curves demonstrating the diagnostic accuracy of plasma biomarkers are shown in Figure 2. Across all comparisons, the highest AUC values were seen with plasma P‐tau181; AD dementia versus CU [AUC = 0.91, 95% confidence interval [CI] 0.86‐0.96; Figure 2A]; AD dementia versus MCI [AUC = 0.75, 95% CI 0.67‐0.83; Figure 2B]; MCI versus CU [AUC = 0.71, 95% CI 0.63‐0.79; Figure 2C]; MCI converters versus non‐converters [AUC = 0.77, 95% CI, 0.61‐0.84; Figure 2D]; and MCI converters versus CU [AUC = 0.87, 95% CI 0.74‐0.98; Figure 2E]). In three of these five contrasts, the AUC for plasma P‐tau181 was significantly higher than that of the next best‐performing plasma marker: AD dementia versus CU (NfL, P < 0.001), MCI converters versus non‐converters (Aβ42/Aβ40, P < 0.05), and MCI converters versus CU (NfL, P < 0.01). For the investigated contrasts, combining P‐tau181 with any additional biomarkers or APOE did not result in significantly higher AUC values. Using logistic regression, lower AIC values (indicating better model fit) were observed for models with P‐tau181 only—as compared to models combining all plasma biomarkers—across the five contrasts investigated in the ROC analyses (Table S4).
FIGURE 2.

Discriminative performance of biomarkers across diagnostic groups. Receiver‐operating characteristics (ROC) curves displaying the performance of plasma P‐tau181, NfL, Aβ42, Aβ42/Aβ40, T‐tau, and GFAp to distinguish (A) Alzheimer's disease (AD) dementia from cognitively unimpaired (CU), (B) mild cognitive impairment (MCI) from CU, (C) AD dementia from MCI, (D) individuals with MCI at baseline who later converted to AD dementia (MCI converters) from those who did not convert during the follow‐up, and (E) MCI converters versus CU. Abbreviations: Aβ42/40, amyloid‐β42/40; AD, Alzheimer's disease; AUC, area under the curve; CU, cognitively unimpaired; GFAp, glial fibrillary acidic protein; MCI, mild cognitive impairment; NfL, neurofilament light; P‐tau181, phosphorylated tau 181; T‐tau, total tau. MCI = patients who did not progress to any type of dementia; MCI‐AD = patients who progressed to AD dementia.
3.4. Longitudinal trajectories of plasma biomarkers
Change in plasma measures over time are shown in Figure. In AD dementia, plasma P‐tau181 (Figure S1A) and NfL (Figure S1B) increased significantly over time (β = 5.34, 95% CI 3.19‐7.32; P < 0.001; β = 3.28, 95% CI 1.46‐6.97, P < 0.01, respectively). A similar pattern was observed for both measures in MCI (P‐tau181: β = 4.40, 95% CI 1.20‐7.71; P < 0.01; NfL: β = 3.79 95% CI 1.06‐12.14, P < 0.01). No significant findings were found for the remaining measures. Furthermore, none of the biomarkers changed over time in CU.
3.5. Plasma biomarkers and longitudinal cognitive decline
Figure 3 shows the association between baseline plasma measures on longitudinal change in MMSE scores. Panels A‐F illustrate estimates based on separate LME models for each predictor—adjusted for age, sex, education, diagnosis, and APOE ε4—with cognitive trajectories shown by plasma terciles (eg, high, moderate, and low). More abnormal plasma measures were associated with an accelerated decline in MMSE scores. Because interactions between plasma measures and diagnosis were significant, LME models were also applied within diagnostic groups (Figure S2). In AD dementia, high P‐tau181 at baseline was associated with low baseline MMSE scores (β = −0.34, 95% CI −0.39 to −0.28; P < 0.001) and accelerated declines in MMSE (β = −0.23, 95% CI −0.45 to −0.04; P < 0.001, Figure 3A). Plasma NfL and MMSE were also significantly associated at baseline (β = −0.30, 95% CI −0.40 to −0.28; P < 0.001) but showed only a trend level association longitudinally (β = −0.07, 95% CI −0.29 to 0.12; P = 0.05, Figure 3B). In MCI, even though not significantly associated with baseline MMSE, elevated P‐tau181 at baseline was associated with steeper declines in MMSE (β = −0.07, 95% CI −0.28 to −0.05; P < 0.001). Plasma Aβ42/Aβ40 levels and MMSE were significantly associated at baseline but showed only a trend‐level association over time (P = 0.07; Figure 3D). No significant associations were found between plasma biomarkers and MMSE in CU participants. Similar findings were obtained when examining the association between plasma biomarkers and annual change in MMSE by diagnostic subgroup using linear regression (adjusted for age, sex, education and APOE ε4 genotype) (Table S5). The relationships between baseline plasma biomarkers and longitudinal changes in MMSE by diagnostic subgroup are shown in Figure S2.
FIGURE 3.
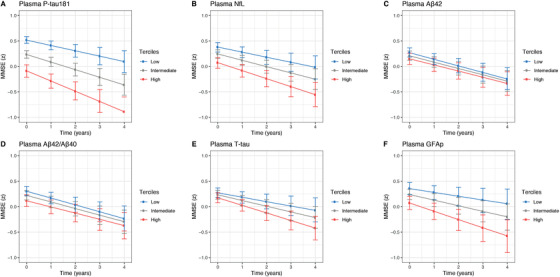
Baseline plasma biomarker concentrations and longitudinal cognitive decline. Plasma measures was used as continuous predictors, but for visualization purposes, the graphs show results for terciles (high, intermediate, and low concentration): (A) P‐tau181, (B) NfL, (C) Aβ42, (D) Aβ42/Aβ40, (E) T‐tau, and (F) GFAp at baseline. Abbreviations: Aβ42/40, amyloid‐β42/40; GFAp, glial fibrillary acidic protein; NfL, neurofilament light; P‐tau181, phosphorylated tau 181; T‐tau, total tau. Estimated means and 95% confidence interval (CI) from linear mixed‐effects models adjusted for age, sex, educational level, diagnosis, and APOE ε4 genotype.
3.6. Plasma biomarkers and longitudinal brain atrophy
Figure 4A shows voxelwise associations between plasma measures at baseline and longitudinal change in GM volume using the pooled cohort, adjusted for age, sex, APOE ε4, center, and diagnosis. Aside from Aβ measures (Aβ42 > Aβ42/Aβ40), which showed some correlation to GM loss in the orbitofrontal cortex (P < 0.05; RFT corrected), P‐tau181 was the only measure that showed significant associations (P < 0.05; RFT corrected) to GM volume after correcting for multiple comparisons. Using baseline plasma levels, higher P‐tau181 was significantly related to GM volume loss in the medial and lateral temporal lobe (P < 0.05; RFT corrected) (Figure 4A). Longitudinally, increasing plasma P‐tau181 was predominantly associated with decreasing GM volume in the medial and lateral temporal lobe (Figure 4B), as well as in the posterior cingulate and opercula (P < 0.05; RFT corrected). Findings by diagnostic subgroup (CU, MCI, AD) are shown in Figures S3‐S5. Within the CU group, the strongest associations between longitudinal change of Aβ42 and Aβ42/Aβ40 and GM volume change were seen in the posterior cingulate and prefrontal cortex. Within the AD group, baseline P‐tau181, Aβ42/Aβ40, T‐tau, and GFAp were associated with GM volume change. Using longitudinal measures, associations were comparatively sparse and largely seen in anterior temporal and orbitofrontal regions using P‐tau181 and NfL.
FIGURE 4.
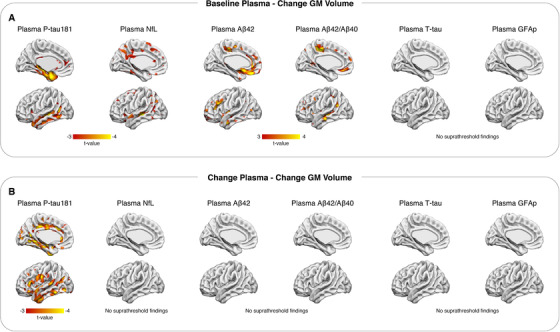
Baseline and delta biomarker concentrations and longitudinal gray matter (GM) loss. T‐statistical parametric maps (P < 0.05, random field theory (RFT) corrected) showing the association between plasma measures at baseline and longitudinal gray matter loss (change GM volume; A). B shows the association between longitudinal plasma (change plasma) and change GM volume. Abbreviations: Aβ42/40, amyloid‐β42/40; GFAp, glial fibrillary acidic protein; NfL, neurofilament light; P‐tau181, phosphorylated tau 181; T‐tau, total tau
4. DISCUSSION
In this study, we demonstrated that putative plasma biomarkers for AD pathology, neurodegeneration, and astrogliosis are significantly altered in AD dementia as compared to CU and MCI. Only P‐tau181 and NfL were increased in MCI as compared to CU, and P‐tau181 significantly increased in MCI converters versus non‐converters. P‐tau181 was the only plasma biomarker that could provide high diagnostic accuracy to distinguish AD dementia from CU (AUC = 0.91). Furthermore, plasma P‐tau181 was the only biomarker associated with cognitive decline. In analyses comparing baseline plasma measures with longitudinal structural MRI, we observed that P‐tau181, and to a lesser extent Aβ42/Aβ40, correlated with GM loss. Furthermore, increasing concentrations of plasma P‐tau181 were associated significantly with GM loss, while this was not seen for the other biomarkers investigated.
In the present study, P‐tau181 was the only plasma biomarker to show high diagnostic accuracy to identify AD. This diagnostic accuracy, however, was marginally lower than studies where Aβ and tau (the A and T components of ATN) status3 had been determined using CSF or PET‐based biomarkers15, 16, 17 (Table S6), where these diagnostic capabilities are comparable to that of CSF P‐tau18138 but inferior to Tau PET.39, 40 We also confirmed previous findings showing that the predictive power of plasma P‐tau181 for separating MCI and AD dementia is relatively low when no information on Aβ is available.17 However, in this study, the diagnostic accuracy was high for the separation of patients with cognitive impairment (MCI and AD) from CU controls. We demonstrate that some clinically classified MCI and AD dementia patients exhibit low plasma P‐tau181 concentrations. Our previous studies on plasma P‐tau181 do indicate that dementia patients without Aβ pathology present with low plasma P‐tau181.15, 16, 17, 18 Thus we would speculate that an individual clinically diagnosed as having AD dementia or MCI but presenting with low plasma P‐tau181 may be more indicative of non‐AD pathology than AD pathology in accordance with the ATN system outlined in the National Institute on Aging–Alzheimer's Association (NIA‐AA) framework.3 In these cases, further clinical evaluation may be needed to determine the cause of the cognitive decline. Indeed, we have shown that retrospective plasma P‐tau181 values significantly improved the clinical evaluation of AD dementia patients, as it predicts neuropathologically confirmed AD with high accuracy.41 Furthermore, the association of plasma P‐tau181 at baseline with both cognitive decline and GM atrophy, particularly in brain regions vulnerable to AD pathology, is in line with the idea that tau pathology is an important driver of cortical atrophy42, 43 and verifies that plasma P‐tau181 is indeed tracking meaningful pathophysiological features of AD. At the group level, baseline and longitudinal plasma levels and GM atrophy measures were more associated in the AD group, whereas the association of higher P‐tau181 and MMSE decline was stronger in the MCI group. These results indicate that plasma P‐tau181 concentrations could be used to monitor individuals during a typically short clinical trial period and to predict short‐term disease progression in clinical practice. Plasma P‐tau181 was the best predictor of cognitive decline, corroborating the results of an earlier study, which found P‐tau181 to be better at predicting conversion to AD dementia in CU or MCI cases compared to other plasma biomarkers.15 Thus evidence is emerging that P‐tau181 is a promising biomarker with great potential to identify and monitor AD in clinical routine and pharmaceutical trials. Yet, it must be recognized that further information on plasma P‐tau181 is required to fulfill these applications: optimal preanalytical conditions, optimal sample matrices type (eg, EDTA plasma or serum), the influence of hemolysis, fasting versus non‐fasting sample collection, centrifugation conditions, and how freeze‐thaw cycles affect precision. Furthermore, although there are emerging data on longitudinal measures of P‐tau181,19, 41, 44 including this study, how P‐tau181 concentrations fluctuate in serial sampling over a shorter period is not yet known.
Moderate diagnostic capabilities of NfL were observed in this study. NfL, which is one of the main constituents of the axonal cytoskeleton, has emerged as a clinically useful biomarker of general neuroaxonal injury, found in most neurodegenerative diseases,45, 46, 47 including AD,10 as well as in infectious,30 traumatic,48 neuroinflammatory,49 and vascular50 conditions.13 There was also a trend‐level association between baseline NfL and longitudinal cognitive decline. However, because the relationship between NfL and MMSE scores at baseline were highly significant, the failure to show the statistically significant association longitudinally seen in other studies10 might be explained by the number of participants with longitudinal MMSE, possibly in conjunction with the relatively short follow‐up time of this study. Baseline or longitudinal increases of plasma NfL levels were not associated with GM volume loss, and this is likely due to NfL being a marker for white matter damage in cognitively impaired individuals.51, 52 Plasma NfL may act as a complimentary biomarker to P‐tau181 in clinical practice. When P‐tau181 is seen to be negative, a positive NfL test would be indicative of a non‐Alzheimer's neurodegenerative disorder and the patient should undergo further investigation (eg, fluorodeoxyglucose [FDG]‐PET or dopamine imaging). A negative test for both modalities would suggest that the individual is unlikely to have progressive neurodegenerative disease (Parkinson disease being an exception).13, 53
Although it has been possible to measure plasma Aβ for a number of years, early studies failed to consistently detect a difference between AD and CU.54 However, owing to technological advances in immunoprecipitation coupled with mass spectrometry (IPMS) and ultrasensitive immunoassay techniques, a large number of studies have now demonstrated meaningful diagnostic accuracies of plasma Aβ measurements for cerebral amyloid and AD.6, 7, 8, 55, 56 Although we found lower levels of Aβ42/Aβ40 in AD dementia, as compared to MCI and CU, which is in line with previous findings,6, 8, 55 comparatively low diagnostic performance was observed across all comparisons. A significant association, however, was observed between baseline Aβ42/Aβ40 and Aβ42 with GM loss in the orbitofrontal cortex. Furthermore, baseline Aβ42 and longitudinal changes in Aβ42/Aβ40, however, were not associated with GM loss in MCI or AD but confined to CU participants, largely in the posterior cingulate and prefrontal cortex. These data show that although this Aβ immunoassay is relatively poor diagnostically, it can capture relevant pathophysiological aspects of AD continuum—which is suggested in our data to be strongest preclinically. The group comparisons of T‐tau also demonstrated low diagnostic capability, despite being statistically significant, which is in line with previous reports.57, 58 Yet, no associations between baseline and longitudinal measures of plasma T‐tau were found with GM change. In a similar manner, significant increases in plasma GFAp were also found in AD dementia patients but showed relatively poor diagnostic accuracy, was not longitudinally altered, did not associate with cognitive decline, or was not related to GM loss in the whole sample. Yet, in the AD group alone, a significant association was observed between baseline T‐tau and GFAp and GM volume change over time. This was stronger for GFAp, primarily in the cuneus, posterior cingulate, and medial prefrontal cortex.
A previous study has demonstrated that P‐tau181 was the best plasma indicator of AD risk, which is comparable to CSF P‐tau181, and that the addition of other plasma biomarkers did not improve this association.15 We corroborate these findings by demonstrating that plasma P‐tau181 is superior predictor of disease state, in any comparison, and that by adding Aβ42/Aβ40, T‐tau, GFAp, or NfL to P‐tau181 did not improve the diagnostic accuracy. Janelidze et al. also showed that the combination P‐tau181 and Aβ42/Aβ40 was the best predictor of Aβ status. Although this analysis cannot be performed in this study, we provide clear evidence that baseline measure of plasma Aβ is the only other plasma biomarker associated with AD‐related brain changes, which are relatively stronger in unimpaired disease status. Therefore, although plasma P‐tau is currently the leading blood biomarker for potential clinical application, the combination of P‐tau and Aβ species could serve as a superior assessment of preclinical or prodromal AD pathology for clinical trials.
The strengths of this study include the large sample size at baseline, and the availability of longitudinal clinical assessment, MRI scans, and serial plasma measurements. We have also assessed the most prominent putative blood biomarkers head‐to‐head, including plasma P‐tau181, which has proven to be a potential biomarker for clinical use. Potential limitations of this study include the use of Simoa‐based measurements for Aβ42/Aβ40, which has been shown inferior to IPMS methods6, 7 or the fully automated Elecsys immunoassay (Roche Diagnostics)8 in terms of its ability to accurately detect Aβ pathology and AD dementia. Similarly, we acknowledge that plasma P‐tau217 could not be added as a comparison in this study.59 Second, this research cohort had exclusion criteria in place to enrich for AD, which likely resulted in a more homogenous patient selection than one would expected in a primary care setting. Third, we did not have a gold‐standard biomarker (eg, CSF biomarkers, PET, or neuropathological assessments) to confirm AD pathology in accordance with the ATN system3 in MCI or AD dementia cases. This would have allowed for the examination of how plasma biomarkers, particularly P‐tau181, perform in suspected non‐Alzheimer's disease (SNAP) pathophysiology. In addition, there were no CU participants who converted to MCI, which could have further corroborated the prognostic value of P‐tau181 at the earliest stage. This is likely to be, at least in part, due to the relatively high dropout rate in the MCI group. This also applies to the number of participants with MCI who eventually converted to AD, which limited the potential to perform more advanced statistics in this group alone. Yet, we were still able to demonstrate that higher plasma P‐tau181 levels at MCI indicate a faster progression to AD dementia and corroborates previous studies.15, 60 Finally, the comparatively modest associations observed between plasma biomarkers and atrophy measures precluded generalizability of results at the diagnostic group level given our modest sample size. Further studies using larger sample sizes are needed to properly characterize the relationship between plasma markers and neurodegeneration across the AD continuum.
5. CONCLUSIONS
An increasing body of evidence suggests that plasma biomarkers are diagnostically meaningful and are associated with clinical progression in AD. In this study, we have shown the superior diagnostic and prognostic utility of plasma P‐tau181 as compared to other putative plasma biomarkers (Aβ42/Aβ40, NfL, T‐tau, and GFAp) of AD. Plasma P‐tau181 has potential value in primary care and memory clinics settings as a rapid and accurate tool in patient management. Furthermore, plasma P‐tau181, potentially in combination with plasma Aβ42/40 preclinically, will be of interest for monitoring disease progression in clinical trials.
DISCLOSURES
Drs. Joel Simrén, Antoine Leuzy, Thomas K. Karikari, Abdul Hye, Andréa Lessa Benedet, Juan Lantero Rodriguez, Niklas Mattsson‐Carlgren, Michael Schöll, Patrizia Mecocci, Bruno Vellas, Magda Tsolaki, Iwona Kloszewska, Simon Lovestone, Dag Aarsland, Pedro Rosa‐Neto, Eric Westman, and Nicholas J. Ashton report no disclosures. Dr. Hilkka Soininen has served in consulting or advisory board for ACImmune, MERCK, and Novo Nordisk. Dr. Oskar Hansson has acquired research support (for the institution) from Roche, Pfizer, GE Healthcare, Biogen, AVID Radiopharmaceuticals, and Euroimmun, and has received consultancy or speaker fees (paid to the institution) from Biogen and Roche. Dr. Kaj Blennow has served as a consultant or on advisory boards for Axon, Biogen, CogRx, Lilly, MagQu, Novartis, and Roche Diagnostics. Dr. Henrik Zetterberg has served at scientific advisory boards for Denali, Roche Diagnostics, Wave, Samumed, Siemens Healthineers, Pinteon Therapeutics, and CogRx; has given lectures in symposia sponsored by Fujirebio, Alzecure, and Biogen; and is a co‐founder of Brain Biomarker Solutions in Gothenburg AB (BBS), which is a part of the GU Ventures Incubator Program (outside submitted work). Drs. Henrik Zetterberg and Kaj Blennow are co‐founders of Brain Biomarker Solutions in Gothenburg, a GU Ventures‐based platform company at the University of Gothenburg.
FUNDING
Anna Lisa and Brother Björnsson's Foundation. Dr. Kaj Blennow is supported by the Swedish Research Council (#2017‐00915), the Alzheimer Drug Discovery Foundation (ADDF), USA (#RDAPB‐201809‐2016615), the Swedish Alzheimer Foundation (#AF‐742881), Hjärnfonden, Sweden (#FO2017‐0243), the Swedish state under the agreement between the Swedish government and the County Councils, the ALF‐agreement (#ALFGBG‐715986), and European Union Joint Program for Neurodegenerative Disorders (JPND2019‐466‐236). Dr. Henrik Zetterberg is a Wallenberg Scholar supported by grants from the Swedish Research Council (#2018‐02532), the European Research Council (#681712), Swedish State Support for Clinical Research (#ALFGBG‐720931), the Alzheimer Drug Discovery Foundation (ADDF), USA (#201809‐2016862), and the UK Dementia Research Institute at UCL.
AUTHOR CONTRIBUTIONS
Concept and design: Joel Simrén, Antoine Leuzy, Kaj Blennow, Henrik Zetterberg, Nicholas J. Ashton, and the AddNeuroMed consortium. Acquisition, analysis, or interpretation of data: Original data in this study acquired by Joel Simrén, Antoine Leuzy, Thomas K. Karikari, Andréa Lessa Benedet, Kaj Blennow, Henrik Zetterberg, and Nicholas J. Ashton. Drafting of the manuscript: Joel Simrén, Antoine Leuzy, Kaj Blennow, Henrik Zetterberg, and Nicholas J. Ashton. Critical revision of the manuscript for important intellectual content: All authors. Statistical analysis: Joel Simrén, Antoine Leuzy, Kaj Benedet, and Nicholas J. Ashton. Obtained funding: Antoine Leuzy, Kaj Blennow, Henrik Zetterberg, and Nicholas J. Ashton. Administrative, technical, or material support: Abdul Hye, Eric Westman, and the AddNeuroMed consortium. Supervision: Henrik Zetterberg and Nicholas J. Ashton.
Supporting information
Supporting information.
Simrén J, Leuzy A, Karikari TK, et al. The diagnostic and prognostic capabilities of plasma biomarkers in Alzheimer's disease. Alzheimer's Dement. 2021;17:1145–1156. 10.1002/alz.12283
REFERENCES
- 1.Scholl M, Maass A, Mattsson N, et al. Biomarkers for tau pathology. Mol Cell Neurosci. 2019;97:18‐33. [DOI] [PMC free article] [PubMed] [Google Scholar]
- 2.Ashton NJ, Scholl M, Heurling K, et al. Update on biomarkers for amyloid pathology in Alzheimer's disease. Biomark Med. 2018;12(7):799‐812. [DOI] [PubMed] [Google Scholar]
- 3.Jack CR Jr, Bennett DA, Blennow K, et al. NIA‐AA Research Framework: toward a biological definition of Alzheimer's disease. Alzheimers Dement. 2018;14(4):535‐562. [DOI] [PMC free article] [PubMed] [Google Scholar]
- 4.Dubois B, Feldman HH, Jacova C, et al. Advancing research diagnostic criteria for Alzheimer's disease: the IWG‐2 criteria. Lancet Neurol. 2014;13(6):614‐629. [DOI] [PubMed] [Google Scholar]
- 5.McKhann GM, Knopman DS, Chertkow H, et al. The diagnosis of dementia due to Alzheimer's disease: recommendations from the National Institute on Aging‐Alzheimer's Association workgroups on diagnostic guidelines for Alzheimer's disease. Alzheimers Dement. 2011;7(3):263‐269. [DOI] [PMC free article] [PubMed] [Google Scholar]
- 6.Nakamura A, Kaneko N, Villemagne VL, et al. High performance plasma amyloid‐beta biomarkers for Alzheimer's disease. Nature. 2018;554(7691):249‐254. [DOI] [PubMed] [Google Scholar]
- 7.Schindler SE, Bollinger JG, Ovod V, et al. High‐precision plasma beta‐amyloid 42/40 predicts current and future brain amyloidosis. Neurology. 2019;93(17):e1647‐e1659. [DOI] [PMC free article] [PubMed] [Google Scholar]
- 8.Palmqvist S, Janelidze S, Stomrud E, et al. Performance of fully automated plasma assays as screening tests for Alzheimer disease‐related beta‐amyloid status. JAMA Neurol. 2019;76(9):1060‐1069. [DOI] [PMC free article] [PubMed] [Google Scholar]
- 9.Oeckl P, Halbgebauer S, Anderl‐Straub S, et al. Glial fibrillary acidic protein in serum is increased in Alzheimer's disease and correlates with cognitive impairment. J Alzheimers Dis. 2019;67(2):481‐488. [DOI] [PubMed] [Google Scholar]
- 10.Mattsson N, Cullen NC, Andreasson U, Zetterberg H, Blennow K. Association between longitudinal plasma neurofilament light and neurodegeneration in patients with Alzheimer disease. JAMA Neurol. 2019;76(7):791‐799. [DOI] [PMC free article] [PubMed] [Google Scholar]
- 11.Benedet AL, Ashton NJ, Pascoal TA, et al. Plasma neurofilament light associates with Alzheimer's disease metabolic decline in amyloid‐positive individuals. Alzheimers Dement (Amst). 2019;11:679‐689. [DOI] [PMC free article] [PubMed] [Google Scholar]
- 12.Ashton NJ, Leuzy A, Lim YM, et al. Increased plasma neurofilament light chain concentration correlates with severity of post‐mortem neurofibrillary tangle pathology and neurodegeneration. Acta Neuropathol Commun. 2019;7(1):5. [DOI] [PMC free article] [PubMed] [Google Scholar]
- 13.Ashton NJ, Janelidze S, Al Ahmad K, Leuzy A, Van der Ende EL, Karikari TK, Diagnostic value of plasma neurofilament light: A multicentre validation study. PREPRINT (Version 1) available at Research Square [+https://doiorg/1021203/rs3rs‐63386/v1+]. 31 August 2020.
- 14.Mielke MM, Hagen CE, Xu J, et al. Plasma phospho‐tau181 increases with Alzheimer's disease clinical severity and is associated with tau‐ and amyloid‐positron emission tomography. Alzheimers Dement. 2018;14(8):989‐997. [DOI] [PMC free article] [PubMed] [Google Scholar]
- 15.Janelidze S, Mattsson N, Palmqvist S, et al. Plasma P‐tau181 in Alzheimer's disease: relationship to other biomarkers, differential diagnosis, neuropathology and longitudinal progression to Alzheimer's dementia. Nat Med. 2020;26(3):379‐386. [DOI] [PubMed] [Google Scholar]
- 16.Thijssen EH, La Joie R, Wolf A, et al. Diagnostic value of plasma phosphorylated tau181 in Alzheimer's disease and frontotemporal lobar degeneration. Nat Med. 2020;26(3):387‐397. [DOI] [PMC free article] [PubMed] [Google Scholar]
- 17.Karikari TK, Pascoal TA, Ashton NJ, et al. Blood phosphorylated tau 181 as a biomarker for Alzheimer's disease: a diagnostic performance and prediction modelling study using data from four prospective cohorts. Lancet Neurol. 2020;19(5):422‐433. [DOI] [PubMed] [Google Scholar]
- 18.Benussi A, Karikari TK, Ashton N, et al. Diagnostic and prognostic value of serum NfL and p‐Tau181in frontotemporal lobar degeneration. J Neurol Neurosurg Psychiatry. 2020;91(9):960‐967. [DOI] [PubMed] [Google Scholar]
- 19.Karikari TK, Benedet AL, Ashton NJ, et al. Diagnostic performance and prediction of clinical progression of plasma phospho‐tau181 in the Alzheimer's Disease Neuroimaging Initiative. Mol Psychiatry. 2020. [DOI] [PubMed] [Google Scholar]
- 20.Lovestone S, Francis P, Kloszewska I, et al. AddNeuroMed–the European collaboration for the discovery of novel biomarkers for Alzheimer's disease. Ann N Y Acad Sci. 2009;1180:36‐46. [DOI] [PubMed] [Google Scholar]
- 21.Lovestone S, Francis P, Strandgaard K. Biomarkers for disease modification trials–the innovative medicines initiative and AddNeuroMed. J Nutr Health Aging. 2007;11(4):359‐361. [PubMed] [Google Scholar]
- 22.McKhann G, Drachman D, Folstein M, Katzman R, Price D, Stadlan EM. Clinical diagnosis of Alzheimer's disease: report of the NINCDS‐ADRDA Work Group under the auspices of department of health and human services task force on Alzheimer's Disease. Neurology. 1984;34(7):939‐944. [DOI] [PubMed] [Google Scholar]
- 23.Petersen RC, Smith GE, Waring SC, Ivnik RJ, Tangalos EG, Kokmen E. Mild cognitive impairment: clinical characterization and outcome. Arch Neurol. 1999;56(3):303‐308. [DOI] [PubMed] [Google Scholar]
- 24.Simmons A, Westman E, Muehlboeck S, et al. MRI measures of Alzheimer's disease and the AddNeuroMed study. Ann N Y Acad Sci. 2009;1180:47‐55. [DOI] [PubMed] [Google Scholar]
- 25.Muehlboeck JS, Westman E, Simmons A. TheHiveDB image data management and analysis framework. Front Neuroinform. 2014;7:49. [DOI] [PMC free article] [PubMed] [Google Scholar]
- 26.Sled JG, Zijdenbos AP, Evans AC. A nonparametric method for automatic correction of intensity nonuniformity in MRI data. IEEE Trans Med Imaging. 1998;17(1):87‐97. [DOI] [PubMed] [Google Scholar]
- 27.Cocosco CA, Zijdenbos AP, Evans AC. A fully automatic and robust brain MRI tissue classification method. Med Image Anal. 2003;7(4):513‐527. [DOI] [PubMed] [Google Scholar]
- 28.Ashburner J, Friston KJ. Voxel‐based morphometry–the methods. Neuroimage. 2000;11(6 Pt 1):805‐821. [DOI] [PubMed] [Google Scholar]
- 29.Sattlecker M, Khondoker M, Proitsi P, et al. Longitudinal protein changes in blood plasma associated with the rate of cognitive decline in Alzheimer's disease. J Alzheimers Dis. 2016;49(4):1105‐1114. [DOI] [PubMed] [Google Scholar]
- 30.Gisslen M, Price RW, Andreasson U, et al. Plasma concentration of the Neurofilament Light Protein (NFL) is a biomarker of CNS injury in HIV infection: a cross‐sectional study. EBioMedicine. 2016;3:135‐140. [DOI] [PMC free article] [PubMed] [Google Scholar]
- 31.Hanley JA, McNeil BJ. A method of comparing the areas under receiver operating characteristic curves derived from the same cases. Radiology. 1983;148(3):839‐843. [DOI] [PubMed] [Google Scholar]
- 32.Hanley JA, McNeil BJ. The meaning and use of the area under a receiver operating characteristic (ROC) curve. Radiology. 1982;143(1):29‐36. [DOI] [PubMed] [Google Scholar]
- 33.Robin X, Turck N, Hainard A, et al. pROC: an open‐source package for R and S+ to analyze and compare ROC curves. BMC Bioinformatics. 2011;12:77. [DOI] [PMC free article] [PubMed] [Google Scholar]
- 34.Akaike H. A new look at the statistical model identification. IEEE Transactions on Automatic Control. 1974;19(6):716‐723. [Google Scholar]
- 35.Olofsen E, Dahan A. Using Akaike's information theoretic criterion in mixed‐effects modeling of pharmacokinetic data: a simulation study. F1000Res. 2013;2:71. [DOI] [PMC free article] [PubMed] [Google Scholar]
- 36.Mathotaarachchi S, Wang S, Shin M, et al. VoxelStats: a MATLAB Package for Multi‐Modal Voxel‐Wise Brain Image Analysis. Front Neuroinform. 2016;10:20. [DOI] [PMC free article] [PubMed] [Google Scholar]
- 37.Worsley KJ, Marrett S, Neelin P, Vandal AC, Friston KJ, Evans AC. A unified statistical approach for determining significant signals in images of cerebral activation. Hum Brain Mapp. 1996;4(1):58‐73. [DOI] [PubMed] [Google Scholar]
- 38.Mattsson N, Smith R, Strandberg O, et al. Comparing (18)F‐AV‐1451 with CSF t‐tau and p‐tau for diagnosis of Alzheimer disease. Neurology. 2018;90(5):e388‐e395. [DOI] [PMC free article] [PubMed] [Google Scholar]
- 39.Leuzy A, Smith R, Ossenkoppele R, et al. Diagnostic performance of RO948 F 18 tau positron emission tomography in the differentiation of Alzheimer disease from other neurodegenerative disorders. JAMA Neurol. 2020;77(8):955‐965. [DOI] [PMC free article] [PubMed] [Google Scholar]
- 40.Ossenkoppele R, Rabinovici GD, Smith R, et al. Discriminative accuracy of [18F]flortaucipir positron emission tomography for Alzheimer disease vs other neurodegenerative disorders. JAMA. 2018;320(11):1151‐1162. [DOI] [PMC free article] [PubMed] [Google Scholar]
- 41.Lantero Rodriguez J, Karikari TK, Suarez‐Calvet M, et al. Plasma p‐tau181 accurately predicts Alzheimer's disease pathology at least 8 years prior to post‐mortem and improves the clinical characterisation of cognitive decline. Acta Neuropathol. 2020;140(3):267‐278. [DOI] [PMC free article] [PubMed] [Google Scholar]
- 42.La Joie R, Visani AV, Baker SL, et al. Prospective longitudinal atrophy in Alzheimer's disease correlates with the intensity and topography of baseline tau‐PET. Sci Transl Med. 2020;12(524). [DOI] [PMC free article] [PubMed] [Google Scholar]
- 43.Gordon BA, McCullough A, Mishra S, et al. Cross‐sectional and longitudinal atrophy is preferentially associated with tau rather than amyloid beta positron emission tomography pathology. Alzheimers Dement (Amst). 2018;10:245‐252. [DOI] [PMC free article] [PubMed] [Google Scholar]
- 44.Moscoso A, Grothe MJ, Ashton NJ, et al. Time course of phosphorylated tau181 in blood across the Alzheimer's disease spectrum. medRxiv. 2020. 2020.2007.2013.20152025. [DOI] [PMC free article] [PubMed] [Google Scholar]
- 45.Rohrer JD, Woollacott IO, Dick KM, et al. Serum neurofilament light chain protein is a measure of disease intensity in frontotemporal dementia. Neurology. 2016;87(13):1329‐1336. [DOI] [PMC free article] [PubMed] [Google Scholar]
- 46.Verde F, Steinacker P, Weishaupt JH, et al. Neurofilament light chain in serum for the diagnosis of amyotrophic lateral sclerosis. J Neurol Neurosurg Psychiatry. 2019;90(2):157‐164. [DOI] [PubMed] [Google Scholar]
- 47.Rojas JC, Karydas A, Bang J, et al. Plasma neurofilament light chain predicts progression in progressive supranuclear palsy. Ann Clin Transl Neurol. 2016;3(3):216‐225. [DOI] [PMC free article] [PubMed] [Google Scholar]
- 48.Shahim P, Zetterberg H, Tegner Y, Blennow K. Serum neurofilament light as a biomarker for mild traumatic brain injury in contact sports. Neurology. 2017;88(19):1788‐1794. [DOI] [PMC free article] [PubMed] [Google Scholar]
- 49.Siller N, Kuhle J, Muthuraman M, et al. Serum neurofilament light chain is a biomarker of acute and chronic neuronal damage in early multiple sclerosis. Mult Scler. 2019;25(5):678‐686. [DOI] [PubMed] [Google Scholar]
- 50.Gattringer T, Pinter D, Enzinger C, et al. Serum neurofilament light is sensitive to active cerebral small vessel disease. Neurology. 2017;89(20):2108‐2114. [DOI] [PMC free article] [PubMed] [Google Scholar]
- 51.Moore EE, Hohman TJ, Badami FS, et al. Neurofilament relates to white matter microstructure in older adults. Neurobiol Aging. 2018;70:233‐241. [DOI] [PMC free article] [PubMed] [Google Scholar]
- 52.Zetterberg H, Skillback T, Mattsson N, et al. Association of cerebrospinal fluid neurofilament light concentration with Alzheimer disease progression. JAMA Neurol. 2016;73(1):60‐67. [DOI] [PMC free article] [PubMed] [Google Scholar]
- 53.Hansson O, Janelidze S, Hall S, et al. Blood‐based NfL: a biomarker for differential diagnosis of parkinsonian disorder. Neurology. 2017;88(10):930‐937. [DOI] [PMC free article] [PubMed] [Google Scholar]
- 54.Olsson B, Lautner R, Andreasson U, et al. CSF and blood biomarkers for the diagnosis of Alzheimer's disease: a systematic review and meta‐analysis. Lancet Neurol. 2016;15(7):673‐684. [DOI] [PubMed] [Google Scholar]
- 55.Janelidze S, Stomrud E, Palmqvist S, et al. Plasma beta‐amyloid in Alzheimer's disease and vascular disease. Sci Rep. 2016;6:26801. [DOI] [PMC free article] [PubMed] [Google Scholar]
- 56.Verberk IMW, Slot RE, Verfaillie SCJ, et al. Plasma amyloid as prescreener for the earliest Alzheimer pathological changes. Ann Neurol. 2018;84(5):648‐658. [DOI] [PMC free article] [PubMed] [Google Scholar]
- 57.Mattsson N, Zetterberg H, Janelidze S, et al. Plasma tau in Alzheimer disease. Neurology. 2016;87(17):1827‐1835. [DOI] [PMC free article] [PubMed] [Google Scholar]
- 58.Zetterberg H, Wilson D, Andreasson U, et al. Plasma tau levels in Alzheimer's disease. Alzheimers Res Ther. 2013;5(2):9. [DOI] [PMC free article] [PubMed] [Google Scholar]
- 59.Palmqvist S, Janelidze S, Quiroz YT, et al. Discriminative accuracy of plasma phospho‐tau217 for Alzheimer disease vs other neurodegenerative disorders. JAMA. 2020;324(8):772‐781. [DOI] [PMC free article] [PubMed] [Google Scholar]
- 60.Karikari TK, Benedet AL, Ashton NJ, et al. Diagnostic performance and prediction of clinical progression of plasma phospho‐tau181 in the Alzheimer's disease neuroimaging initiative. medRxiv. 2020. 2020.2007.2015.20154237. [DOI] [PubMed] [Google Scholar]
Associated Data
This section collects any data citations, data availability statements, or supplementary materials included in this article.
Supplementary Materials
Supporting information.