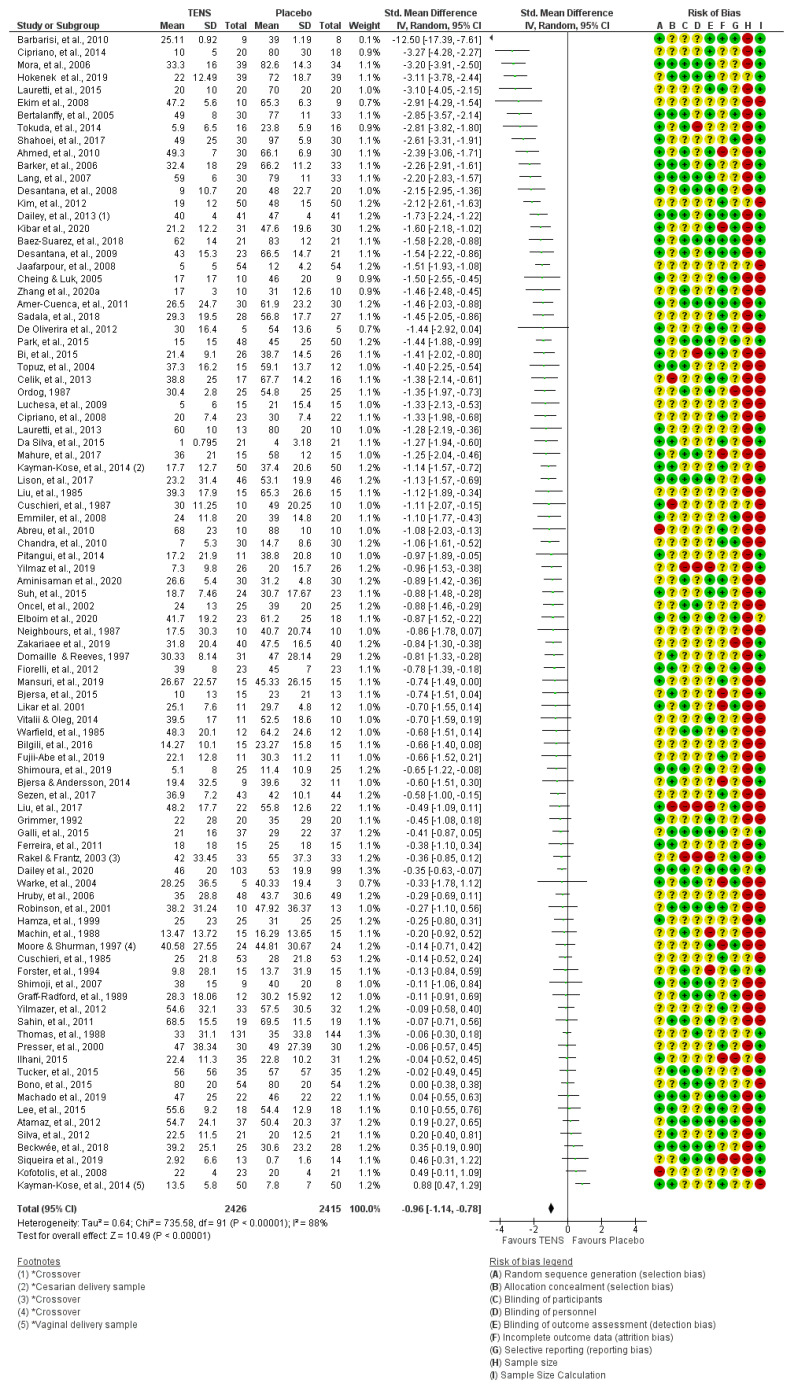
Figure 15.
TENS versus placebo for pain intensity (continuous data) as standardised mean difference (SMD), including individual risk of bias (RoB) judgements. Green + circles = low RoB, Yellow ? circles = unclear RoB, Red circles = high RoB, * = calls attention to the footnote: ◂ = SMD and 95% confidence intervals lie outside the range of the horizontal axis −12.5 (−17.39, −7.61): ♦ = Overall measure of effect, the lateral points indicate confidence intervals for this estimate. The sequence of the in-figure reference citations from top to bottom are [43], [86], [249], [166], [201], [115], [52], [356], [321], [19], [44], [198], [104], [187], [95], [186], [39], [105], [176], [75], [393], [30], [310], [101], [277], [53], [358], [71], [268], [225], [85], [200], [94], [230], [184], [221], [222], [92], [118], [16], [73], [285], [386], [31], [346], [266], [116], [258], [392], [112], [135], [237], [57], [213], [377], [381], [54], [140], [325], [56], [320], [223], [152], [141], [132], [293], [96], [382], [168], [305], [156], [229], [248], [91], [139], [324], [149], [387], [311], [352], [289], [173], [364], [60], [228], [206], [36], [329], [48], [332], [192] and [184].

