

Abstract
The striatum and cerebral cortex are interconnected via multiple recurrent loops that play a major role in many neuropsychiatric conditions. Primate corticostriatal connections can be precisely mapped using invasive tract-tracing. However, noninvasive human research has not mapped these connections with anatomical precision, limited in part by the practice of averaging neuroimaging data across individuals. Here we utilized highly sampled resting-state functional connectivity MRI for individual-specific precision functional mapping (PFM) of corticostriatal connections. We identified ten individual-specific subnetworks linking cortex—predominately frontal cortex—to striatum, most of which converged with nonhuman primate tract-tracing work. These included separable connections between nucleus accumbens core/shell and orbitofrontal/medial frontal gyrus; between anterior striatum and dorsomedial prefrontal cortex; between dorsal caudate and lateral prefrontal cortex; and between middle/posterior putamen and supplementary motor/primary motor cortex. Two subnetworks that did not converge with nonhuman primates were connected to cortical regions associated with human language function. Thus, precision subnetworks identify detailed, individual-specific, neurobiologically plausible corticostriatal connectivity that includes human-specific language networks.
Keywords: brain networks, fMRI, functional connectivity, individual variability, striatum
Introduction
The striatum (putamen, caudate, nucleus accumbens, and globus pallidus) is critically important for optimizing and executing goal-directed behaviors across multiple modalities (Cohen and Frank 2009; Haber 2016), ranging from motor planning and control (Grillner et al. 2005), to manipulation of items in working memory (Frank et al. 2001), to complex value judgments (Schultz et al. 1998; Schultz and Dickinson 2000). The striatum works in close concert with the cortex—and especially the frontal cortex—via a series of parallel, partially segregated cortico-striato-thalamo-cortical circuits (Nakano et al. 2000; Haber 2003). The integrity of corticostriatal connectivity is critical for healthy brain function, as its disruption causes devastating neurological and psychiatric symptoms in disorders such as Parkinson’s and Huntington’s disease (Bunner and Rebec 2016; Blumenstock and Dudanova 2020). Even relatively minor alterations in corticostriatal circuitry are thought to play a major role in symptoms observed in Tourette syndrome (Mink 2001; Greene et al. 2017), schizophrenia (Simpson et al. 2010), obsessive–compulsive disorder (Harrison et al. 2009), depression (Borsini et al. 2020), and autism (Li and Pozzo-Miller 2019). However, corticostriatal circuits are some of the least well-understood pathways in the human brain, as their striatal elements are small and exceedingly difficult to dissociate from each other using noninvasive imaging. Precise, detailed, individual-specific characterization of corticostriatal circuits is a fundamental first step to understanding how they help generate complex behaviors and is vitally important for treating many neurodegenerative and neuropsychiatric disorders, especially with targeted neurostimulation (e.g., using deep brain stimulation [DBS], or focused ultrasound).
Nonhuman primate research using autoradiographic tracer injections has demonstrated that the striatum receives topographically ordered projections from a wide variety of cortical sources (Yeterian and Van Hoesen 1978; Van Hoesen et al. 1981; Selemon and Goldman-Rakic 1985, 1988; Cavada and Goldman-Rakic 1991; Steele and Weller 1993; Webster et al. 1993; Yeterian and Pandya 1993, 1998; Cheng et al. 1997; Chikama et al. 1997), though projections from frontal cortex are thought to be the main input driving striatal function (Haber 2003). Nonhuman primate frontostriatal circuits have an ordered organization that is mirrored in striatum and cerebral cortex (Haber 2016). Specifically, rostral portions of frontal cortex project to punctate regions within rostral striatum (Kunishio and Haber 1994; Haber et al. 1995), while progressively more caudal frontal cortex projects to progressively caudal striatal targets (Künzle 1975; Selemon and Goldman-Rakic 1985; Flaherty and Graybiel, 1994, p. 1975; Calzavara et al. 2007; Averbeck et al. 2014).
The frontostriatal organization observed in nonhuman primates is largely assumed to have been conserved in the human brain (Haber 2016). However, the complex cognitive and psychiatric symptoms caused by striatal dysfunction point toward human-specific aspects of frontostriatal connectivity. Further, relative to nonhuman primates, the prefrontal cortex is expanded in humans (Smaers et al. 2011), and pathways for language processing have developed (Dick and Tremblay 2012; Friederici 2017).
Precisely mapping human frontostriatal connections with noninvasive imaging has been challenging. Techniques such as diffuse optical tomography, electroencephalography, and magnetoencephalography cannot obtain signal from the brain center. MRI-based techniques such as resting-state functional connectivity (RSFC), which involves identifying correlated patterns of activity in spatially distant regions of the brain (Biswal et al. 1995), have proven successful in describing the brain’s network organization (Power et al. 2011; Yeo et al. 2011). However, these techniques suffer rapid drop-off of signal-to-noise (SNR) ratios as distance increases from the head coil. Standard approaches for overcoming low SNR in the brain center require registering study participants to a common atlas and averaging their data. Such group-averaged neuroimaging studies have been limited to describing broad, nonspecific connections between large swaths of striatum and widespread regions of cortex, distributed large-scale networks, or entire cortical lobes (Di Martino et al. 2008; Draganski et al. 2008; Badre and Frank 2012; Choi et al. 2012; Mestres-Missé et al. 2012; Verstynen et al. 2012; Greene et al. 2014; Jeon et al. 2014; Tziortzi et al. 2014; Jarbo and Verstynen 2015; Morris et al. 2016; Marquand et al. 2017; Parkes et al. 2017).
Such group-averaging approaches can be problematic for detailed description of brain organization, because there is significant cross-individual spatial variability in the network organization of both the cortex (Harrison et al. 2015; Wang et al. 2015; Braga and Buckner 2017; Gordon, Laumann, Adeyemo, Petersen 2017b; Gordon, Laumann, Gilmore, et al. 2017c; Li et al. 2019) and the thalamus (Greene et al. 2020), such that features of functional brain organization are not present at the same location in all subjects. Consequently, group-averaging neuroimaging approaches fail to identify spatially localized organizational features that can be observed in individuals (Gordon, Laumann, Adeyemo, Gilmore, et al. 2017a; Bijsterbosch et al. 2018; Feilong et al. 2018; Harrison et al. 2020), and this issue is likely magnified in the striatum due to its small size. Thus, prior use of group-averaged data may have obscured important aspects of frontostriatal organization present in individual humans.
Recent approaches for noninvasively describing the individual-specific organization of the brain using RSFC (termed precision functional mapping, or PFM) have delineated the large-scale network-level organization of the cerebral cortex (Laumann et al. 2015; Braga and Buckner 2017; Gordon, Laumann, Gilmore, et al. 2017c; Braga et al. 2020) and thalamus (Greene et al. 2020) in individuals. We recently extended PFM to demonstrate the presence of subnetwork structures within classic large-scale networks that comprise strong, functionally differentiated connections between spatially specific cortical and subcortical regions (Gordon et al. 2020). The high spatial specificity of connections that can be identified using this subnetwork-PFM technique makes it ideal for characterizing detailed, spatially specific frontostriatal connections.
Here, we precisely characterized frontostriatal connections in individual humans. We identified subnetworks that describe corticostriatal connections in 10 individual human brains using > 5 h of RSFC data per individual (Midnight Scan Club [MSC] dataset). We examined the degree to which the observed organization of corticostriatal connections converged with or differed from existing models of frontostriatal connectivity based on nonhuman primate data (Haber 2016).
Materials and Methods
Subjects
Data were collected from 10 healthy, right-handed, young adult subjects (5 females; age: 24–34). Two of the subjects are authors (NUFD and SMN), and the remaining subjects were recruited from the Washington University community. Informed consent was obtained from all participants. The study was approved by the Washington University School of Medicine Human Studies Committee and Institutional Review Board. Other findings using these participants have been previously reported in (Gordon, Laumann, Gilmore, et al. 2017c; Gratton et al. 2018; Marek et al. 2018; Greene et al. 2020; Sylvester et al. 2020).
MRI Image Acquisition
Imaging for each subject was performed on a Siemens TRIO 3 T MRI scanner over the course of 12 sessions conducted on separate days, each beginning at midnight. Structural MRI was conducted across two separate days. In total, four T1-weighted images (sagittal, 224 slices, 0.8 mm isotropic resolution, TE = 3.74 ms, TR = 2400 ms, TI = 1000 ms, flip angle = 8 degrees), four T2-weighted images (sagittal, 224 slices, 0.8 mm isotropic resolution, TE = 479 ms, TR = 3200 ms), four MRA (transverse, 0.6 × 0.6 × 1.0 mm, 44 slices, TR = 25 ms, TE = 3.34 ms), and eight MRVs, including four in coronal and four in sagittal orientations (sagittal: 0.8 × 0.8 × 2.0 mm thickness, 120 slices, TR = 27 ms, TE = 7.05 ms; coronal: 0.7 × 0.7 × 2.5 mm thickness, 128 slices, TR = 28 ms TE = 7.18 ms), were obtained for each subject. Analyses of the MRA and MRV scans are not reported here.
On 10 subsequent days, each subject underwent 1.5 h of functional MRI scanning beginning at midnight. In each session, we first collected thirty contiguous minutes of resting-state fMRI data, in which subjects visually fixated on a white crosshair presented against a black background. Each subject was then scanned during performance of three separate tasks, which are not examined here. Across all sessions, each subject was scanned for 300 total minutes during the resting state. All functional imaging was performed using a gradient-echo EPI sequence (TR = 2.2 s, TE = 27 ms, flip angle = 90°, voxel size = 4 mm × 4 mm × 4 mm, 36 slices). In each session, one gradient echo field map sequence was acquired with the same prescription as the functional images. An EyeLink 1000 eye-tracking system (http://www.sr-research.com) allowed continuous monitoring of subjects’ eyes in order to check for periods of prolonged eye closure, potentially indicating sleep. Only one subject (MSC08) demonstrated prolonged eye closures.
Cortical Surface Generation
Generation of cortical surfaces from the MRI data followed a procedure similar to that previously described in (Marek et al. 2018). First, anatomical surfaces were generated from the subject’s average T1-weighted image in native volumetric space using FreeSurfer’s default recon-all processing pipeline (version 5.3). This pipeline first conducted brain extraction and segmentation. After this step, segmentations were hand-edited to maximize accuracy. Subsequently, the remainder of the recon-all pipeline was conducted on the hand-edited segmentations, including generation of white matter and pial surfaces, inflation of the surfaces to a sphere, and surface shape–based spherical registration of the subject’s original surface to the fsaverage surface (Dale et al. 1999; Fischl et al. 1999). The fsaverage-registered left and right hemisphere surfaces were brought into register with each other using deformation maps from a landmark-based registration of left and right fsaverage surfaces to a hybrid left–right fsaverage surface (“fs_LR”; Van Essen et al. 2012). These fs_LR spherical template meshes were input to a flexible multimodal surface matching (MSM) algorithm using sulc features to register templates to the atlas mesh (Robinson et al. 2014). These newly registered surfaces were then down-sampled to a 32 492 vertex surface (fs_LR 32k) for each hemisphere. The various structural metric data (thickness, curvature, etc.) from the original surfaces to the fs_LR 32k surface were composed into a single deformation map allowing for one-step resampling. MSM registration provided a more optimal fit of pial and white surfaces and reduced areal distortion (Glasser et al. 2016). These various surfaces in native stereotaxic space were then transformed into atlas space (711-2B) by applying the previously calculated T1-to-atlas transformation.
fMRI Preprocessing
Functional data were preprocessed to reduce artifacts and to maximize cross-session registration. All sessions underwent correction of odd versus even slice intensity differences attributable to interleaved acquisition, intensity normalization to a whole-brain mode value of 1000, and within run correction for head movement. Atlas transformation was computed by registering the mean intensity image from a single BOLD session to Talairach atlas space (Talairach and Tournoux 1988) via the average high-resolution T2-weighted image and average high-resolution T1-weighted image. All subsequent BOLD sessions were linearly registered to this first session. This atlas transformation, mean field distortion correction (see below), and resampling to 2-mm isotropic atlas space were combined into a single interpolation using FSL’s applywarp tool (Smith et al. 2004). All subsequent operations were performed on the atlas-transformed volumetric time series.
Distortion Correction
A mean field map was generated based on the field maps collected in each subject (Laumann et al. 2015). This mean field map was then linearly registered to each session and applied to that session for distortion correction. To generate the mean field map, the following procedure was used: 1) Field map magnitude images were mutually coregistered. 2) Transforms between all sessions were resolved. Transform resolution reconstructs the n-1 transforms between all images using the n(n − 1)/2 computed transform pairs. 3) The resolved transforms were applied to generate a mean magnitude image. 4) The mean magnitude image was registered to an atlas-representative template. 5) Transforms from individual session magnitude images to atlas space were computed by composing the session-to-mean and mean-to-atlas transforms. 6) Phase images were then transformed to atlas space using the composed transforms, and a mean phase image in atlas space was computed.
Application of mean field map to individual fMRI sessions: 1) For each session, field map uncorrected data were registered to atlas space, as above. 2) The generated transformation matrix was then inverted and applied to the mean field map to bring the mean field map into the session space. 3) The mean field map was used to correct distortion in each native-space run of resting state and task data in the session. 4) The undistorted data were then reregistered to atlas space. 5) This new transformation matrix and the mean field map then were applied together to resample each run of resting state and task data in the session to undistorted atlas space in a single step.
RSFC Preprocessing
Additional preprocessing steps to reduce spurious variance unlikely to reflect neuronal activity were executed as recommended in (Power et al. 2014; Ciric et al. 2017). First, temporal masks were created to flag motion-contaminated frames. We observed that two subjects (MSC 03 and MSC 10) had a high-frequency artifact in the motion estimates calculated in the phase encode (anterior–posterior) direction that did not appear to reflect biological movement. We thus filtered the motion estimate time courses in this direction only to retain effects occurring below 0.1 Hz in all subjects for consistency (Gratton et al. 2020). Motion-contaminated volumes were then identified by frame-by-frame displacement (FD). Frames with FD > 0.2 mm were flagged as motion-contaminated. Across all subjects, these masks censored 28% ± 18% (range: 6–67%) of the data; on average, subjects retained 5929 ± 1508 volumes (range: 2733–7667), corresponding to 217 ± 55 min (range: 100–281).
After computing the temporal masks for high motion frame censoring, the data were processed with the following steps: 1) demeaning and detrending, 2) linear interpolation across censored frames using so that continuous data can be passed through, 3) a band-pass filter (0.005 Hz < f < 0.01 Hz) without reintroducing nuisance signals (Hallquist et al. 2013) or contaminating frames near high motion frames (Carp 2013).
Next, the filtered BOLD time series underwent a component-based nuisance regression approach (Marek et al. 2018). Nuisance regression using time series extracted from white matter and cerebrospinal fluid (CSF) assumes that variance in such regions is unlikely to reflect neural activity. Variance in these regions is known to correspond largely to physiological noise (e.g., CSF pulsations), arterial pCO2-dependent changes in T2*-weighted intensity, and motion artifact; this spurious variance is widely shared with regions of interest in gray matter. We also included the mean signal averaged over the whole brain as a nuisance regressor. Global signal regression (GSR) has been controversial. However, the available evidence indicates that GSR is a highly effective denoising strategy (Power et al. 2015; Ciric et al. 2017).
Nuisance regressors were extracted from white matter and ventricle masks, first segmented by FreeSurfer (Fischl 2012), and then spatially resampled in register with the fMRI data. Voxels surrounding the edge of the brain are particularly susceptible to motion artifacts and CSF pulsations (Satterthwaite et al. 2013; Patriat et al. 2015); hence, a third nuisance mask was created for the extra-axial compartment by thresholding the temporal standard deviation image (SDt > 2.5%), excluding a dilated whole-brain mask. Voxel-wise nuisance time series were dimensionality reduced as in CompCor (Behzadi et al. 2007), except that the number of retained regressors, rather than being a fixed quantity, was determined, for each noise compartment, by orthogonalization of the covariance matrix and retaining components ordered by decreasing eigenvalue up to a condition number of 30 (max eigenvalue/min eigenvalue > 30). The retained components across all compartments formed the columns of a design matrix, X, along with the global signal, its first derivative, and the six time series derived by retrospective motion correction. The columns of X are likely to exhibit substantial colinearity. Therefore, to prevent numerical instability owing to rank-deficiency during nuisance regression, a second-level SVD was applied to XXT to impose an upper limit of 250 on the condition number. This final set of regressors was applied in a single step to the filtered, interpolated BOLD time series, with censored data ignored during beta estimation. Finally, the data were upsampled to 2 mm isotropic voxels. Censored frames were then excised from the data for all subsequent analyses.
Surface Processing and CIFTI Generation of BOLD Data
Surface processing of BOLD data proceeded through the following steps. First, the BOLD fMRI volumetric time series were sampled to each subject’s original midthickness left- and right-hemisphere surfaces (generated as the average of the white and pial surfaces) using the ribbon-constrained sampling procedure available in Connectome Workbench 1.0. This procedure samples data from voxels within the gray matter ribbon (i.e., between the white and pial surfaces) that lie in a cylinder orthogonal to the local midthickness surface weighted by the extent to which the voxel falls within the ribbon. Voxels with a time series coefficient of variation 0.5 standard deviations higher than the mean coefficient of variation of nearby voxels (within a 5-mm sigma Gaussian neighborhood) were excluded from the volume to surface sampling, as described in (Glasser et al. 2013). Once sampled to the surface, timecourses were deformed and resampled from the individual’s original surface to the 32-k fs_LR surface in a single step using the deformation map generated above (in “Cortical Surface Generation”). This resampling allows point-to-point comparison between each individual registered to this surface space.
These surfaces were then combined with volumetric subcortical and cerebellar data into the CIFTI format using Connectome Workbench (Marcus et al. 2011), creating full brain timecourses excluding non–gray matter tissue. Subcortical (including accumbens, amygdala, caudate, hippocampus, pallidum, putamen, and thalamus) and cerebellar voxels were selected based on the FreeSurfer segmentation of the individual subject’s native-space average T1, transformed into atlas space, and manually inspected. Finally, the BOLD timecourses were smoothed with a geodesic 2D (for surface data) or Euclidean 3D (for volumetric data) Gaussian kernel of σ = 2.55 mm.
Regression of Adjacent Cortical Tissue from RSFC BOLD
Some striatal regions (e.g., lateral putamen) are in close anatomical proximity to cortex, potentially resulting in spurious functional coupling between the cortical vertices and adjacent subcortical voxels due to local autocorrelation. To reduce this effect, RSFC BOLD time series from all vertices falling within 20-mm Euclidean distance of a source voxel were averaged and then regressed from the voxel time series in order to remove the autocorrelation, following (Buckner et al. 2011; Marek et al. 2018; Greene et al. 2020).
Mapping Multiscale Network Structure
The network organization of each subject’s brain was delineated following (Gordon et al. 2020) using the graph-theory-based Infomap algorithm for community detection (Rosvall and Bergstrom 2008). In this approach, we calculated the cross-correlation matrix of the time courses from all brain vertices (on the cortical surfaces) and voxels (in subcortical structures), concatenated across sessions. Correlations between vertices/voxels within 30 mm of each other were set to zero in this matrix to avoid basing network membership on correlations attributable to spatial smoothing. Geodesic distance was used for within-hemisphere surface connections and Euclidean distance for subcortical-to-cortical connections. Connections between subcortical structures were disallowed, as we observed extremely high connectivities within nearly the entire basal ganglia that would prevent network structures from emerging. Interhemispheric connections between the cortical surfaces were retained, as smoothing was not performed across the midsagittal plane.
We observed that connectivity patterns within regions known to have low BOLD signal due to susceptibility artifact dropout (e.g., ventral anterior temporal lobe and portions of orbitofrontal cortex) were effectively random. To avoid having the delineated network structures distorted by such random connections, we first calculated a set of common low-signal regions as the vertices in which the average mode-1000 normalized BOLD signal across subjects and timepoints was less than 750 (as in Wig et al. 2014; Gordon et al. 2016). All connections to these low-signal regions were set to zero. These vertices converged with regions known to suffer severe signal loss due to susceptibility artifact and to the presence of veinous structures (see Supplementary Fig. 1 for excluded vertices).
This matrix was then thresholded to retain at least the strongest 0.1% of connections to each vertex and voxel (Gordon et al. 2020). Note that this thresholding approach differs from previous approaches for forming brain graphs from functional connectivity data (e.g., Power et al. 2011; Gordon, Laumann, Gilmore, et al. 2017c). The typical procedure applies a uniform edge density threshold to all functional connectivity values in the brain. The weakness of the uniform threshold approach is that subcortical structures generally have decreased BOLD signal-to-noise relative to cortex due to their greater distance from the MR head coil. The result is that functional connectivity patterns seeded from striatal voxels have weaker peak connectivity strengths, even though they may appear well organized and coherent with known cortical networks. Thus, with a uniform threshold, these regions are frequently not identified as being networked with cortical regions.
By contrast, the current approach thresholds the connectivity maps seeded from each cortical or subcortical point in the brain separately, always retaining at least the 0.1% strongest connections. The result is that the connectivity of all striatal voxels are represented in the brain graph used for community detection. Previous validation of this procedure (Gordon et al. 2020) has shown that the 0.1% density threshold identifies subnetwork divisions in resting data that best explain task activations in these subjects.
The thresholded matrices were used as inputs for the Infomap algorithm, which calculated community assignments separately for each threshold. The resulting communities represent subnetworks in the brain. Small networks with 10 or fewer vertices/voxels were considered unassigned and removed from further consideration. The above analysis was conducted in each individual subject.
Identifying Matched Striatal Subnetworks in Individuals
For each subject, we considered only subnetworks that had at least some representation in the striatum (the individually defined caudate, putamen, nucleus accumbens, and globus pallidus). Following (Gordon et al. 2020), we visually examined the cortical and subcortical topographies of each subnetwork with striatal representation, as well as their topological arrangement relative to each other. After careful consideration of the subnetworks observable in this population, matched subnetworks were identified based on the following heuristic rules:
A subnetwork in inferior ventral striatum usually also had representation in subgenual cingulate and/or orbitofrontal cortex.
A subnetwork in anterior ventral striatum had representation in bilateral pregenual cingulate cortex. This subnetwork was previously described in (Gordon et al. 2020).
A subnetwork in superior ventral striatum had representation in anterior cingulate cortex and middle insula.
A subnetwork that was spatially variable within striatum, with representation most often in medial putamen, but was consistently present in dorsal anterior cingulate cortex and dorsal insula.
A subnetwork in lateral middle putamen and posterior dorsomedial prefrontal cortex.
A subnetwork in dorsal caudate that had consistent representation as the dorsomedial cluster of the frontoparietal network and inconsistent representation in lateral frontal and parietal cortex.
A subnetwork in medial anterior putamen (especially left putamen) that had consistent cortical representation converging with the language network (Braga et al. 2020).
A subnetwork in lateral anterior caudate (especially left caudate) that had representation to a set of cortical regions directly anterior to the language network above.
A subnetwork (sometimes multiple subnetworks) in ventral posterior putamen that had representation somewhere in the central sulcus, with the location of the representation varying substantially by subject.
Additionally, we commonly observed subnetworks that were generally in posterior lateral putamen (but with variable representation across subjects) that had cortical representation only in middle insular cortex, physically adjacent to the striatal representation, or (in one subject) in unusual locations such as medial occipital lobe. These subnetworks also often cut implausibly across disjoint anatomical structures such as putamen and thalamus. These subnetworks were tentatively classified as noise-related and were ignored for future analyses.
Determining Amount of Data Required to Reliably Identify Individual-Specific Subnetworks
To determine the quantity of data required to reliably identify each subject’s frontostriatal subnetworks, we iteratively subsampled varying amounts (5–100 min) of contiguous data from each subject’s concatenated cross-session fMRI timecourses. Given the computational demands of this analysis, only 10 iterations were conducted for each data amount within each subject. For each iterative subsampling, we replicated the community detection approach employed for the whole dataset. The communities derived from the subsampled data were matched to that subject’s full-data frontostriatal subnetworks based on the Dice coefficient of overlap. We allowed a combination of multiple communities to match the subnetwork if that combination produced the optimal Dice overlap. The overall overlap for each iteration was computed as the average Dice coefficient across all frontostriatal subnetworks.
Determining Individual-Specific Large-Scale Network Identities
We identified the set of canonical large-scale networks using the individual-specific network matching approach described in (Gordon, Laumann, Gilmore, et al. 2017c). Briefly, the Infomap algorithm was applied to each subject’s correlation matrix thresholded at a range of edge densities spanning from 0.01% to 5%. At each threshold, the algorithm returned community identities for each vertex and voxel. Communities were labeled by matching them at each threshold to a set of independent group average networks described in (Gordon, Laumann, Gilmore, et al. 2017c). The matching approach proceeded as follows: 1) At each density threshold, all identified communities were compared with the independent group networks using the Jaccard Index of spatial overlap. 2) The community with the best match (highest overlap) to one of the independent networks was assigned that network identity, and then not considered for further comparison with other independent networks within that threshold. Matches lower than Jaccard = 0.1 were not considered (to avoid matching based on only a few vertices). Matches were first made with the large, well-known networks (default, lateral visual, motor hand, motor mouth, cingulo-opercular, frontoparietal, and dorsal attention), and then to the smaller, less well-known networks (ventral attention, salience, parietal memory, contextual association, medial visual, and motor foot). 3) In each individual and in the average, a “consensus” network assignment was derived by collapsing assignments across thresholds, giving each node the assignment it had at the sparsest possible threshold at which it was successfully assigned to one of the known group networks.
Computing Lobe-Wise Striatal Subnetwork Representation
For each individual subject, we defined the frontal, insular, parietal, temporal, and occipital lobes based on the lobe identities of the regions of the subject-specific FreeSurfer-generated Destrieux atlas parcellation, which was deformed into fs_LR_32k space to match the functional data. Lobe-wise representation was computed within each subject as the percent of cortical vertices among all nonnoise subnetworks that were within each lobe.
Visualizing Subnetwork Overlap across Subjects
For each matched nonnoise subnetwork, the overlap across individuals was visualized using Connectome Workbench. For cortex, the number of individuals with the subnetwork present was calculated in each vertex. For striatum, this was less straightforward, as the subcortical structures were individualized, and so were different shapes and sizes across people. To represent overlap in striatum, we first mapped the subcortical voxels of each individual among MSC02–10 to the subcortical structures in MSC01. This was done by assigning each voxel in the MSC01 structures the network ID of the nearest (by Euclidean distance) subcortical voxel in that individual. Overlap was then calculated across MSC01-space subject subnetworks as the number of individuals with the subnetwork present in each MSC01-space voxel. It should be noted that this procedure was used only for visualization of cross-subject overlap.
Data and Software Availability
Data: Raw MRI data from the MSC Dataset, as well as segmented cortical surfaces, preprocessed volumetric and cifti-space RSFC timecourses, and preprocessed task timecourses and contrasts, have been deposited in the Openneuro data repository (https://openneuro.org/datasets/ds000224/versions/1.0.2) under the label “Midnight Scan Club.”
Code: Code to perform all preprocessing and analysis is available at https://github.com/MidnightScanClub.
Results
Striatal Subnetworks Are Individually Specific but Spatially Similar across Subjects
We delineated individual-specific subnetworks connecting striatum to cortex and matched them across subjects following procedures described in (Gordon et al. 2020). Ten separate subnetworks with both striatal and cortical representation were identified that were spatially and topologically consistent across subjects, with some interindividual variability in the localization of each subnetwork. The spatial representations of these subnetworks spanned from posterior putamen to nucleus accumbens in striatum, and from central sulcus and parietal/temporal lobes in cortex to subgenual cingulate/orbitofrontal cortex. See Figure 1 for an example subject; see Supplementary Figure 2 for all subjects; see Figure 2 for the overlap of each subnetwork across subjects; and see Supplementary Table 1 for information about the consistency of connections. These 10 subnetworks existed as substructures within several known large-scale brain networks, including the default mode, salience, cingulo-opercular, frontoparietal, language, and somatomotor networks (see Fig. 3 for an example subject; see Supplementary Table 1 for mode network memberships across subjects).
Figure 1 .

Corticostriatal subnetworks in an exemplar subject (MSC01). Left: Subnetwork representation in left hemisphere cortex and striatum. Right: Subnetwork representation in bilateral striatum from oblique lateral-posterior (top), dorsal (middle), and anterior (bottom) views.
Figure 2 .
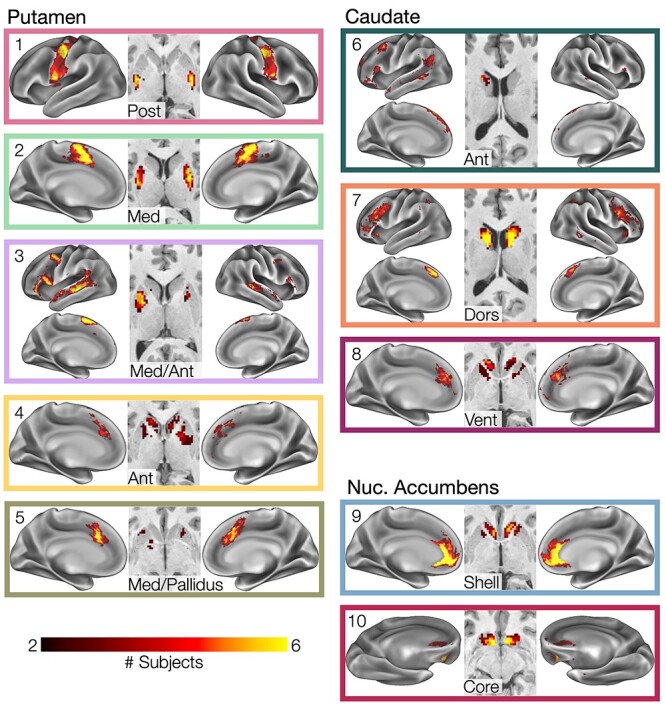
Striatal subnetwork overlap across subjects. Cross-subject overlap of matched striatal subnetworks. Heat map indicates number of subjects with spatial overlap of matched subnetworks at each point in the brain.
Figure 3 .

Striatal subnetworks are substructures within canonical functional networks. Striatal subnetworks in an exemplar subject (MSC01) are contained within known large-scale cortical networks (colored borders).
Corticostriatal subnetworks could not be reliably detected if low quantities of data were used for subnetwork identification (Dice overlap < 0.5). The reliability of identified subnetworks increased in all subjects when increasing data quantities were analyzed and reached an average Dice overlap of 0.75 when at least 90 min of data were utilized (Supplementary Fig. 3). Reliability was lower than for cortex-only functional network for similar quantities of data (Gordon, Laumann, Gilmore, et al. 2017c) likely due to the lower BOLD signal SNR in subcortical structures.
Across subjects, an average of 95% (range: 91–99%) of striatal voxels were matched to one of the ten subnetworks. Thus, the subnetworks described here represent the large majority of strong functional corticostriatal connections, with very little of the striatum containing idiosyncratic subnetwork connections that cannot be matched across subjects.
These subnetworks showed significant overlap with the nonhuman primate-based model of corticostriatal connections advanced by Haber (2016). First, these subnetworks, which represent very strong corticostriatal functional connections, most commonly connected striatum to frontal cortex. In each subject, we calculated the percent of cortical vertices with any subnetwork representation that were within each cortical lobe (Fig. 4A). Across subjects, we found that 70% ± 6% (mean ± SD) of these subnetworks’ cortical vertices were within the frontal lobe, which was higher in every subject than in the insula (10% ± 2%), parietal lobe (9% ± 3%), temporal lobe (10% ± 6%), or occipital lobe (1% ± 1%); all paired ts(9) > 17.0, all Ps < 10−7. Similarly, we evaluated the strength of within-subnetwork corticostriatal RSFC for each lobe in each subject (Fig. 4B). Across subjects, within-subnetwork RSFC between striatal and frontal regions was 0.25 ± 0.02 (mean ± SD), which was higher in every subject than RSFC between striatum and insula (0.15 ± 0.03), parietal lobe (0.11 ± 0.04), temporal lobe (0.10 ± 0.02), or occipital lobe (0.12 ± 0.06); all paired ts(9) > 6.8, all Ps < 0.0002.
Figure 4 .

Striatal subnetworks are primarily connected to frontal cortex. (A) Percent of cortical subnetwork vertices present within each cortical lobe, averaged across subnetworks and subjects. (B) Strength of within-subnetwork functional connectivity between striatum and the vertices within each cortical lobe, averaged across subnetworks and subjects. Error bars represent standard deviation across subjects.
The spatial distributions of these subnetworks in large parts converged with the Haber (2016) model (Fig. 5), with several important exceptions (see below). Projections to posterior and middle putamen originated in motor and premotor cortex, respectively; projections to dorsal caudate originated from dorsomedial and dorsolateral prefrontal cortex; and projections to ventral anterior caudate and medial putamen originated from the dorsal anterior cingulate cortex. Projections to nucleus accumbens originated from medial and orbitofrontal cortex; though notably, the targets of the medial and orbitofrontal cortex projections within nucleus accumbens (to the shell and core, respectively) appeared reversed relative to the nonhuman primate model.
Figure 5 .

Nonhuman primate model and actual organization of human corticostriatal connectivity. (A) Prior organizational model of frontostriatal connections in cortex (left) and striatum (right), based primarily on tract-tracing work in nonhuman primates, proposed by Haber (2016). Images are adapted from Haber (2016), with anatomical locations displayed on a macaque cortex. (B) Organization of corticostriatal connections observed in the present work. Cortical vertices/voxels are colored based on the most common subnetwork present across the 10 subjects. A putative language network (bolded in the inset legend) was not identified in the Haber model. Note that a motor subnetwork is present posterior of the displayed slice in putamen, and a second language network is present anterior of the displayed slice in left caudate.
Importantly, we discovered two subnetworks missing from the nonhuman primate-derived model of corticostriatal connections advanced by Haber (2016) (Fig. 5): 1) a subnetwork (Figs 1–3, #3, Med Ant Putamen, pink) with representation primarily in medial putamen and sometimes lateral caudate head, as well as in a distributed set of cortical regions including dorsomedial prefrontal cortex, inferior frontal gyrus, posterior middle frontal gyrus, and superior temporal sulcus; and 2) a subnetwork (Figs 1–3, #6, Ant Caudate, dark green) with representation in anterior lateral caudate and distributed cortical regions immediately adjacent to the medial putamen subnetwork. See Figure 6A for these subnetworks in all subjects. Notably, the cortical distributions of the medial putamen subnetwork converges with the known distribution of the human language network (Braga et al. 2020), while the distribution of the lateral anterior caudate subnetwork converges with a previously described default mode subnetwork known to link core default regions to the language network (Gordon et al. 2020).
Figure 6 .

Lateralized corticostriatal subnetworks consistent with human language networks. (A) In each subject, bilateral cortical and striatal representations of two subnetworks consistent with known human language networks. (B) Both subnetworks were lateralized (with greater representation in left than right hemisphere) in both cortex and striatum in every subject. No other subnetwork was consistently lateralized across subjects.
Like the human language network, these two subnetworks were left-lateralized, with more extensive left than right hemisphere representation in both cortical and subcortical structures. To quantify this observation, for each subnetwork, we calculated a laterality index as ([# left hemisphere vertices/voxels] − [# right hemisphere vertices/voxels])/[# total vertices/voxels], separately in cortex and in striatum. With this index, positive values indicate left lateralization, while negative values indicate right lateralization. In every subject, these two subnetworks were left-lateralized in both cortex and striatum (medial putamen subnetwork: cortex mean laterality = 0.62 ± 0.24, one-sample t(9) = 7.9, P < 10−4; striatum mean laterality = 0.73 ± 0.32, t(9) = 7.2, P < 10−4; lateral caudate subnetwork: cortex mean laterality = 0.67 ± 0.34, one-sample t(9) = 5.7, P < 0.001; striatum mean laterality = 0.72 ± 0.36, t(9) = 5.4, P < 0.002); see Figure 6B. By contrast, no other subnetwork exhibited consistent lateralization across subjects (all ts(9) < 2.2, all Ps > 0.05 in both cortex and striatum).
Discussion
We identified ten subnetworks representing very strong, anatomically precise, individually specific connections between cortex and striatum that could be matched across subjects. The general corticostriatal organization revealed here, consisting of a progression of very strong connections spanning from primary motor cortex/posterior putamen to nucleus accumbens/ventromedial prefrontal cortex, is broadly consistent with invasive tract-tracing in nonhuman primates (Haber 2003), which is the most anatomically detailed understanding of corticostriatal connectivity we currently possess. It is also consistent with distributed patterns of spiking activity measured in mice (Peters et al. 2021).
The present findings are also consistent with human corticostriatal organization described in prior group-level neuroimaging work using RSFC, task fMRI, and diffusion MRI (Steiner and Tseng 2010; Choi et al. 2012; Mestres-Missé et al. 2012; Verstynen et al. 2012; Jarbo and Verstynen 2015; Marquand et al. 2017; Vogelsang and D’Esposito 2018; O’Rawe et al. 2019; Raut et al. 2020). However, the current findings represent a significant advance as they provide finer detail and specificity to the brain’s frontal–striatal network organization while also demonstrating its interindividual variability. Notably, the subnetwork divisions identified in the present work do not rely on cortically defined priors and thus highlight the specificity of striatal connectivity to the frontal cortex and not to other lobes. Further, they describe separable connections to multiple subdivisions of putative control networks in dorsal anterior cingulate cortex, as well as specific striatal representations of language-related networks in putamen and caudate that have not previously been reported. Critically, the details of these observations were enabled by evaluation within individual humans to avoid their being obscured by group-averaging procedures.
Most Corticostriatal Subnetworks Converge with Primate Tract-Tracing
We identified striatal subnetworks composed of only very strong functional connections in single individuals, and we found that 1) the majority of these very strong corticostriatal connections were from frontal cortex, and 2) frontal regions of these subnetworks had stronger connectivity with striatum than nonfrontal regions, suggesting that the nonfrontal regions we did observe were less strongly associated with striatal activity. This converges with nonhuman primate work arguing that, while striatum does receive inputs from diverse cortical sources across frontal, parietal, insular, and temporal cortex (Yeterian and Van Hoesen 1978; Van Hoesen et al. 1981; Selemon and Goldman-Rakic 1985, 1988; Cavada and Goldman-Rakic 1991; Steele and Weller 1993; Webster et al. 1993; Yeterian and Pandya 1993, 1998; Cheng et al. 1997; Chikama et al. 1997), the strongest, driving projections to striatum arise from frontal lobe (Haber 2003). Thus, the present subnetwork connections represent a substantial increase in specificity over prior human neuroimaging work that identified corticostriatal connections originating from large swaths of cortex and from distributed networks across multiple cortical lobes (Choi et al. 2012; Greene et al. 2014; Tziortzi et al. 2014; Morris et al. 2016; Parkes et al. 2017).
The identified frontostriatal circuits were highly ordered as a topographically mirrored rostral–caudal progression of corticostriatal projections. This organization converged with the organization of these circuits proposed based on findings from nonhuman primates (Haber 2003, 2016); see Figure 5. Specifically, moving from caudal to rostral striatum:
We found functional connections between somatomotor regions in the central sulcus and the posterior putamen (Fig. 5, magenta), consistent with previous observations of projections from precentral motor cortex to posterior putamen in humans (Zeharia et al. 2015) and nonhuman primates (Künzle 1975; Flaherty and Graybiel 1994). These connections are likely related to striatal control over motor function.
We found functional connections between regions just anterior to the somatomotor strip, particularly in dorsomedial prefrontal cortex, and the middle lateral putamen (Fig. 5, green), consistent with previous observations in nonhuman primates of projections from pre-/supplementary motor cortex to middle lateral putamen (Künzle 1978; Haber 2003). These circuits are engaged during performance of complex (nonautomatized) motor skills (Boecker et al. 1998).
We found functional connections between dorsomedial and dorsolateral prefrontal cortex, within the frontoparietal network, and a large extent of dorsal caudate (Fig. 5, orange). This observation is consistent with previous accounts of projections from dorsolateral prefrontal cortex to terminals in dorsal caudate that span a significant rostral–caudal extent (Selemon and Goldman-Rakic 1985; Arikuni and Kubota 1986; Haber et al. 2006), which have been argued to play a critical role in working memory (Partiot et al. 1996).
We found several sets of functional connections between dorsal anterior cingulate cortex/anterior insula and the anterior caudate/putamen (Fig. 5, yellow/maroon/brown). These observations align with known projections from primate dorsal anterior cingulate to anterior caudate and putamen, and particularly to sites more dorsal and lateral than the orbitofrontal cortex (OFC) or ventromedial prefrontal cortex (vmPFC) projections described below (Haber et al. 2006). This set of cortical regions (dorsal anterior cingulate, anterior insula, and anterior striatum) is considered the core of the adjacent “cingulo-opercular” and “salience” networks, which are critical for a wide variety of cognitive control operations.
We found functional connections between nucleus accumbens and pregenual medial prefrontal cortex (mPFC), and a separate set with OFC/subgenual cingulate cortex (Fig. 5, blue/red). These connections match circuitry known to be critical for reward processing/addiction (Haber and Knutson 2010; Koob and Volkow 2016) and mood disorders (Drevets et al. 2008), respectively. The nucleus accumbens is anatomically segregated into a more dorsal shell and a more ventral core (Salgado and Kaplitt 2015). Here, the nucleus accumbens nodes of these two subnetworks exhibited a similar dorsal/ventral distribution; as such, we tentatively label these nodes the accumbens shell and core, respectively.
Interestingly, these connections only partially converged with connectivity identified in nonhuman primates, in which the nucleus accumbens core preferentially receives projections from pregenual mPFC, while the shell receives projections from OFC—the reverse of the arrangement we observed here. It is possible that this divergence from nonhuman primate work is driven by fMRI data quality issues, such as the known presence of susceptibility artifact within ventral prefrontal and orbitofrontal cortex in human fMRI. However, human diffusion tractography imaging has also demonstrated that the accumbens core is more strongly connected to OFC than the shell (Baliki et al. 2013; Xia et al. 2017; Cartmell et al. 2019), convergent with our present findings. Hence, this divergence may represent a true organizational difference between humans and nonhuman primates related to reward processing.
Several of the connections identified here, including to the posterior and middle putamen, dorsal caudate, and nucleus accumbens core, were restricted to a single target subcortical structure. This represents an increase in target specificity relative to the (Haber 2016) model, in which similar frontostriatal projections span the internal capsule (Fig. 5A,B, green and orange) or extend out of nucleus accumbens into caudate (Fig. 5A,B, red). We consider it most likely that frontal projections to multiple striatal structures do exist in humans, but that projections to secondary structures do not drive striatal function as strongly as projections to the primary target structure.
Interestingly, while every subnetwork had representation in the medial frontal cortex in every subject, only a few (e.g., dorsal caudate and posterior putamen) were consistently represented on the lateral surface of the frontal cortex. The reasons for these apparent preferential connections between medial frontal cortex and striatum are not immediately clear. However, we hypothesize that they may be driven by the tendency of evolution to optimize connections between brain regions while minimizing “wiring cost”—particularly the volume of interregional axons—within the constraints of the volume of the skull (Klyachko and Stevens 2003; Bullmore and Sporns 2012). Notably, the medial cortical elements of the subnetworks appear to be arranged so as to globally minimize distances to their striatal targets (see Fig. 1). Further work is needed to test this possibility.
Language-Related Corticostriatal Subnetworks Specific to Humans
We observed two subnetworks that did not converge with proposed models of nonhuman primate frontostriatal connectivity (Haber 2016). These consisted of two adjacent sets of distributed frontotemporal regions connected to anterior medial putamen and anterior lateral caudate (Fig. 5B, pink/dark green). Based on several lines of evidence, we argue that these connections represent circuitry for language processing. First, the cortical elements of these connections are highly convergent with previous descriptions of language-related networks in group-average (Friederici and Gierhan 2013; Ji et al. 2019) and individual (Braga et al. 2020; Gordon et al. 2020) human neuroimaging data. Specifically, cortical aspects of the anterior medial putamen (pink) subnetwork converge with the “core” language network (Braga et al. 2020), while those of the anterior lateral caudate (dark green) subnetwork correspond to a subnetwork we have previously described as linking the language network to the default mode network (Gordon et al. 2020). Second, as with human language function (Friederici 2011; Corballis 2012; Ocklenburg et al. 2014), connections of these two subnetworks were consistently lateralized, with greater extent in the left hemisphere than in the right hemisphere in both cortex and striatum. No other corticostriatal network structure exhibited consistent lateralization across subjects. Third, the striatal elements of these connections converge well with previous work reporting activation in anterior medial putamen (Friederici et al. 2003) and anterior lateral caudate (Mestres-Missé et al. 2012) in response to specifically effortful, nonautomatic language processing. These findings suggest that the striatal elements of these language subnetworks may be critical for learning and executing new language-related tasks, similar to the learning and optimization role ascribed to the striatum in other behavioral domains (Cohen and Frank 2009).
Interestingly, this network is not wholly novel in humans; some connections of this human corticostriatal language network do exist in nonhuman primates. Lateral prefrontal cortex and superior temporal sulcus have been shown to project to each other (Yeterian et al. 2012), and superior temporal cortex projects to lateral caudate and medial putamen (Selemon and Goldman-Rakic 1985; Yeterian and Pandya 1998). However, the multiple elements of the language network (inferior frontal gyrus, posterior middle frontal gyrus, medial superior frontal gyrus, superior temporal sulcus, and striatum) are not known to be all interconnected in nonhuman primates, as our work suggests here in humans. This supports the idea that the human language network is an evolutionarily novel network scaffolded in part upon existing circuitry present in prehuman primates (Dick and Tremblay 2012; Friederici 2017).
Toward a Complete Description of Integrated Cortico-Striato-Thalamic Circuits
It is well established in rodents and nonhuman primates that corticostriatal circuits are further projected to the thalamus, and then back to cortex, forming feedback loops (Nakano et al. 2000; Haber 2003). Thus, in principle, the corticostriatal subnetwork structures we observe here should also be represented in the thalamus. While we did observe this representation to some degree, the thalamus did not consistently contain representations of all corticostriatal subnetworks, and further, the thalamus tended to have extensive representation of subnetworks characterized as noise-related. This suggests that the quality of the MSC fMRI data, while adequate for winner-take-all style whole-network mapping in thalamus (Greene et al. 2020), may not be adequate for the data-driven mapping of highly specific cortico-striato-thalamo-cortical circuits in thalamus. Future work may be able to more broadly conduct such mapping using higher-quality data collected with advanced multiband and multiecho sequences (Lynch et al. 2020).
While the presented delineations of corticostriatal circuits are neurobiologically compelling and individual-specific, they are incomplete. The present analyses focus on the very strongest functional connections to each striatal voxel, representing the likely driving inputs to the striatum. However, frontostriatal circuits are only partially segregated and do exhibit some degree of cross-circuit connectivity (Haber 2003). At the large-scale network level, human RSFC work has also demonstrated cross-network integration zones (Greene et al. 2020). We reproduced analyses from (Greene et al. 2020) at the subnetwork level rather than the network level, and we similarly observed cross-subnetwork connections (Supplementary Fig. 4), suggesting that weaker connections may enable interactions between frontostriatal loops above and beyond the specific, driving inputs that are the focus of the current paper. Untangling the complexity of these multisubnetwork connections for comprehensive evaluation and categorization will be conducted in future work.
Functional connectivity techniques cannot distinguish between mono- and polysynaptic connections, so it is unclear whether the anterior caudate and putamen actually receive direct projections from the language network. However, we note that when only the very strongest functional connections are considered, resulting subnetworks recapitulate known driving monosynaptic frontal cortex inputs to the striatum fairly closely (Haber 2003, 2016). This suggests that while functional connectivity in general may reflect a combination of mono- and polysynaptic projections, the strongest corticostriatal functional connections are more likely to primarily represent monosynaptic projections.
The Utility of Mapping Corticostriatal Circuits in Individual Humans
The present results have important implications for the future study of the human striatum. The discrete subnetworks present within the striatum likely enable a variety of different cognitive and motor processes that can be localized to each separate, individual-specific striatal subnetwork. With such localization, we can generate stronger hypotheses about how individual-specific symptoms observed in neuropsychiatric disorders, neurodegenerative disease, or brain injuries might arise from disruption of those specific frontostriatal circuits. Such symptoms might be optimally alleviated restored via brain stimulation approaches targeting those individual-specific circuits, including noninvasive TMS applied to the cortical sources of frontostriatal projections, or deep electrode implantation localized to their striatal targets.
Notably, the present results illustrate why it is critical to localize functional networks in repeatedly sampled individual humans, rather than in group-average data. The frontal–striatal subnetworks exhibited significant interindividual spatial variability, as illustrated by the limited cross-subject overlap observed in Figure 2. This result is consistent with prior work illustrating that poor cross-subject overlap is more apparent when comparing small network structures than larger networks (Gordon et al. 2020; Harrison et al. 2020). This variability highlights the need for a high degree of precision when attempting to target specific circuits for intervention (e.g., with TMS or DBS).
Supplementary Material
Contributor Information
Evan M Gordon, Department of Radiology, Washington University School of Medicine, St. Louis, MO 63110, USA.
Timothy O Laumann, Department of Psychiatry, Washington University School of Medicine, St. Louis, MO 63110, USA.
Scott Marek, Department of Psychiatry, Washington University School of Medicine, St. Louis, MO 63110, USA.
Dillan J Newbold, Department of Neurology, Washington University School of Medicine, St. Louis, MO 63110, USA.
Jacqueline M Hampton, Department of Psychiatry, Washington University School of Medicine, St. Louis, MO 63110, USA.
Nicole A Seider, Department of Neurology, Washington University School of Medicine, St. Louis, MO 63110, USA.
David F Montez, Department of Neurology, Washington University School of Medicine, St. Louis, MO 63110, USA.
Ashley M Nielsen, Institute for Innovations in Developmental Sciences, Northwestern University, Chicago, IL 60611, USA.
Andrew N Van, Department of Biomedical Engineering, Washington University School of Medicine, St. Louis, MO 63110, USA.
Annie Zheng, Department of Neurology, Washington University School of Medicine, St. Louis, MO 63110, USA.
Ryland Miller, Department of Psychiatry, Washington University School of Medicine, St. Louis, MO 63110, USA; Department of Neurology, Washington University School of Medicine, St. Louis, MO 63110, USA.
Joshua S Siegel, Department of Psychiatry, Washington University School of Medicine, St. Louis, MO 63110, USA.
Benjamin P Kay, Department of Neurology, Washington University School of Medicine, St. Louis, MO 63110, USA.
Abraham Z Snyder, Department of Radiology, Washington University School of Medicine, St. Louis, MO 63110, USA; Department of Neurology, Washington University School of Medicine, St. Louis, MO 63110, USA.
Deanna J Greene, Department of Cognitive Science, University of California San Diego, La Jolla, CA 92093, USA.
Bradley L Schlaggar, Kennedy Krieger Institute, Baltimore, MD 21205, USA; Department of Neurology, Johns Hopkins University School of Medicine, Baltimore, MD 21205, USA; Department of Pediatrics, Johns Hopkins University School of Medicine, Baltimore, MD 21205, USA.
Steven E Petersen, Department of Radiology, Washington University School of Medicine, St. Louis, MO 63110, USA; Department of Neurology, Washington University School of Medicine, St. Louis, MO 63110, USA; Department of Neuroscience, Washington University School of Medicine, St. Louis, MO 63110, USA; Department of Psychological & Brain Sciences, Washington University School of Medicine, St. Louis, MO 63110, USA.
Steven M Nelson, Department of Pediatrics, University of Minnesota, Minneapolis, MN 55454, USA; Masonic Institute for the Developing Brain, University of Minnesota, Minneapolis, MN 55454, USA.
Nico U F Dosenbach, Department of Radiology, Washington University School of Medicine, St. Louis, MO 63110, USA; Department of Neurology, Washington University School of Medicine, St. Louis, MO 63110, USA; Kennedy Krieger Institute, Baltimore, MD 21205, USA; Department of Pediatrics, Washington University School of Medicine, St. Louis, MO 63110, USA; Program in Occupational Therapy, Washington University School of Medicine, St. Louis, MO 63110, USA.
Contributions
D.J.G., S.M.N., J.M.H., A.M.N., and N.U.F.D. collected the data. E.M.G., T.O.L., S.M.N., D.J.G., and A.Z.S. processed and analyzed the data. E.M.G., S.M.N., and N.U.F.D. wrote the paper with input from all authors.
Funding
NIH (F31NS110332 to D.J.N., NS088590 to N.U.F.D., TR000448 to N.U.F.D., MH1000872 to T.O.L., 1R25MH112473 to T.O.L., 5T32 MH100019-02 to S.M., MH104592 to D.J.G., MH123091 to A.Z., 1P30NS098577 (to the Neuroimaging Informatics and Analysis Center); Kiwanis Neuroscience Research Foundation (to N.U.F.D. and B.L.S.); the Jacobs Foundation (2016121703 to N.U.F.D.); the Child Neurology Foundation (N.U.F.D.); the McDonnell Center for Systems Neuroscience (to N.U.F.D. and B.L.S.); the Mallinckrodt Institute of Radiology (14-011 to N.U.F.D.); the Hope Center for Neurological Disorders (to N.U.F.D., B.L.S., and S.E.P.).
Notes
Conflict of Interest: The authors declare no competing interests.
References
- Arikuni T, Kubota K. 1986. The organization of prefrontocaudate projections and their laminar origin in the macaque monkey: a retrograde study using HRP-gel. J Comp Neurol. 244:492–510. [DOI] [PubMed] [Google Scholar]
- Averbeck BB, Lehman J, Jacobson M, Haber SN. 2014. Estimates of projection overlap and zones of convergence within frontal-striatal circuits. J Neurosci. 34:9497–9505. [DOI] [PMC free article] [PubMed] [Google Scholar]
- Badre D, Frank MJ. 2012. Mechanisms of hierarchical reinforcement learning in cortico–striatal circuits 2: evidence from fMRI. Cereb Cortex. 22:527–536. [DOI] [PMC free article] [PubMed] [Google Scholar]
- Baliki MN, Mansour A, Baria AT, Huang L, Berger SE, Fields HL, Apkarian AV. 2013. Parceling human accumbens into putative core and shell dissociates encoding of values for reward and pain. J Neurosci. 33:16383–16393. [DOI] [PMC free article] [PubMed] [Google Scholar]
- Behzadi Y, Restom K, Liau J, Liu TT. 2007. A component based noise correction method (CompCor) for BOLD and perfusion based fMRI. NeuroImage. 37:90–101. [DOI] [PMC free article] [PubMed] [Google Scholar]
- Bijsterbosch JD, Woolrich MW, Glasser MF, Robinson EC, Beckmann CF, Essen DCV, Harrison SJ, Smith SM. 2018. The relationship between spatial configuration and functional connectivity of brain regions. eLife Sci. 7:e32992. [DOI] [PMC free article] [PubMed] [Google Scholar]
- Biswal BB, Yetkin FZ, Haughton VM, Hyde JS. 1995. Functional connectivity in the motor cortex of resting human brain using echo-planar MRI. Magn Reson Med. 34:537–541. [DOI] [PubMed] [Google Scholar]
- Blumenstock S, Dudanova I. 2020. Cortical and striatal circuits in Huntington’s disease. Front Neurosci. 14:82. [DOI] [PMC free article] [PubMed] [Google Scholar]
- Boecker H, Dagher A, Ceballos-Baumann AO, Passingham RE, Samuel M, Friston KJ, Poline J-B, Dettmers C, Conrad B, Brooks DJ. 1998. Role of the human rostral supplementary motor area and the basal ganglia in motor sequence control: investigations with H2 15O PET. J Neurophysiol. 79:1070–1080. [DOI] [PubMed] [Google Scholar]
- Borsini A, Wallis ASJ, Zunszain P, Pariante CM, Kempton MJ. 2020. Characterizing anhedonia: a systematic review of neuroimaging across the subtypes of reward processing deficits in depression. Cogn Affect Behav Neurosci. 20:816–841. [DOI] [PMC free article] [PubMed] [Google Scholar]
- Braga RM, Buckner RL. 2017. Parallel interdigitated distributed networks within the individual estimated by intrinsic functional connectivity. Neuron. 95:457–471.e5. [DOI] [PMC free article] [PubMed] [Google Scholar]
- Braga RM, DiNicola LM, Buckner RL. 2020. Situating the left-lateralized language network in the broader organization of multiple specialized large-scale distributed networks. J Neurophysiol. 124:1415–1448. [DOI] [PMC free article] [PubMed] [Google Scholar]
- Buckner RL, Krienen FM, Castellanos A, Diaz JC, Yeo BTT. 2011. The organization of the human cerebellum estimated by intrinsic functional connectivity. J Neurophysiol. 106:2322–2345. [DOI] [PMC free article] [PubMed] [Google Scholar]
- Bullmore E, Sporns O. 2012. The economy of brain network organization. Nat Rev Neurosci. 13:336–349. [DOI] [PubMed] [Google Scholar]
- Bunner KD, Rebec GV. 2016. Corticostriatal dysfunction in Huntington’s disease: the basics. Front Hum Neurosci. 10:317. [DOI] [PMC free article] [PubMed] [Google Scholar]
- Calzavara R, Mailly P, Haber SN. 2007. Relationship between the corticostriatal terminals from areas 9 and 46, and those from area 8A, dorsal and rostral premotor cortex and area 24c: an anatomical substrate for cognition to action. Eur J Neurosci. 26:2005–2024. [DOI] [PMC free article] [PubMed] [Google Scholar]
- Carp J. 2013. Optimizing the order of operations for movement scrubbing: comment on Power et al. NeuroImage. 76:436–438. [DOI] [PubMed] [Google Scholar]
- Cartmell SCD, Tian Q, Thio BJ, Leuze C, Ye L, Williams NR, Yang G, Ben-Dor G, Deisseroth K, Grill WM, et al. 2019. Multimodal characterization of the human nucleus accumbens. NeuroImage. 198:137–149. [DOI] [PMC free article] [PubMed] [Google Scholar]
- Cavada C, Goldman-Rakic PS. 1991. Topographic segregation of corticostriatal projections from posterior parietal subdivisions in the macaque monkey. Neuroscience. 42:683–696. [DOI] [PubMed] [Google Scholar]
- Cheng K, Saleem KS, Tanaka K. 1997. Organization of corticostriatal and corticoamygdalar projections arising from the anterior inferotemporal area TE of the macaque monkey: a Phaseolus vulgaris leucoagglutinin study. J Neurosci. 17:7902–7925. [DOI] [PMC free article] [PubMed] [Google Scholar]
- Chikama M, McFarland NR, Amaral DG, Haber SN. 1997. Insular cortical projections to functional regions of the striatum correlate with cortical cytoarchitectonic organization in the primate. J Neurosci. 17:9686–9705. [DOI] [PMC free article] [PubMed] [Google Scholar]
- Choi EY, Yeo BTT, Buckner RL. 2012. The organization of the human striatum estimated by intrinsic functional connectivity. J Neurophysiol. 108:2242–2263. [DOI] [PMC free article] [PubMed] [Google Scholar]
- Ciric R, Wolf DH, Power JD, Roalf DR, Baum G, Ruparel K, Shinohara RT, Elliott MA, Eickhoff SB, Davatzikos C, et al. 2017. Benchmarking of participant-level confound regression strategies for the control of motion artifact in studies of functional connectivity. NeuroImage. 154:174–187. [DOI] [PMC free article] [PubMed] [Google Scholar]
- Cohen MX, Frank MJ. 2009. Neurocomputational models of basal ganglia function in learning, memory and choice. Behav Brain Res. Special issue on the role of the basal ganglia in learning and memory. 199:141–156. [DOI] [PMC free article] [PubMed] [Google Scholar]
- Corballis MC. 2012. Chapter 6—lateralization of the human brain. In: Hofman MA, Falk D, editors. Progress in brain research, evolution of the primate brain. Amsterdam, the Netherlands: Elsevier, pp. 103–121. [Google Scholar]
- Dale AM, Fischl B, Sereno MI. 1999. Cortical surface-based analysis: I. Segmentation and surface reconstruction. NeuroImage. 9:179–194. [DOI] [PubMed] [Google Scholar]
- Di Martino A, Scheres A, Margulies DS, Kelly AMC, Uddin LQ, Shehzad Z, Biswal B, Walters JR, Castellanos FX, Milham MP. 2008. Functional connectivity of human striatum: a resting state fMRI study. Cereb Cortex. 18:2735–2747. [DOI] [PubMed] [Google Scholar]
- Dick AS, Tremblay P. 2012. Beyond the arcuate fasciculus: consensus and controversy in the connectional anatomy of language. Brain. 135:3529–3550. [DOI] [PubMed] [Google Scholar]
- Draganski B, Kherif F, Klöppel S, Cook PA, Alexander DC, Parker GJM, Deichmann R, Ashburner J, Frackowiak RSJ. 2008. Evidence for segregated and integrative connectivity patterns in the human basal ganglia. J Neurosci. 28:7143–7152. [DOI] [PMC free article] [PubMed] [Google Scholar]
- Drevets WC, Savitz J, Trimble M. 2008. The subgenual anterior cingulate cortex in mood disorders. CNS Spectr. 13:663–681. [DOI] [PMC free article] [PubMed] [Google Scholar]
- Feilong M, Nastase SA, Guntupalli JS, Haxby JV. 2018. Reliable individual differences in fine-grained cortical functional architecture. NeuroImage. 183:375–386. [DOI] [PubMed] [Google Scholar]
- Fischl B. 2012. FreeSurfer. NeuroImage. 20 years of fMRI. 62:774–781. [DOI] [PMC free article] [PubMed] [Google Scholar]
- Fischl B, Sereno MI, Dale AM. 1999. Cortical surface-based analysis: II: inflation, flattening, and a surface-based coordinate system. NeuroImage. 9:195–207. [DOI] [PubMed] [Google Scholar]
- Flaherty AW, Graybiel AM. 1994. Input-output organization of the sensorimotor striatum in the squirrel monkey. J Neurosci. 14:599–610. [DOI] [PMC free article] [PubMed] [Google Scholar]
- Frank MJ, Loughry B, O’Reilly RC. 2001. Interactions between frontal cortex and basal ganglia in working memory: a computational model. Cogn Affect Behav Neurosci. 1:137–160. [DOI] [PubMed] [Google Scholar]
- Friederici AD. 2017. Evolution of the neural language network. Psychon Bull Rev. 24:41–47. [DOI] [PMC free article] [PubMed] [Google Scholar]
- Friederici AD. 2011. The brain basis of language processing: from structure to function. Physiol Rev. 91:1357–1392. [DOI] [PubMed] [Google Scholar]
- Friederici AD, Gierhan SM. 2013. The language network. Curr Opin Neurobiol, Macrocircuits. 23:250–254. [DOI] [PubMed] [Google Scholar]
- Friederici AD, Rüschemeyer S-A, Hahne A, Fiebach CJ. 2003. The role of left inferior frontal and superior temporal cortex in sentence comprehension: localizing syntactic and semantic processes. Cereb Cortex. 13:170–177. [DOI] [PubMed] [Google Scholar]
- Glasser MF, Smith SM, Marcus DS, Andersson JLR, Auerbach EJ, Behrens TEJ, Coalson TS, Harms MP, Jenkinson M, Moeller S, et al. 2016. The human connectome project’s neuroimaging approach. Nat Neurosci. 19:1175–1187. [DOI] [PMC free article] [PubMed] [Google Scholar]
- Glasser MF, Sotiropoulos SN, Wilson JA, Coalson TS, Fischl B, Andersson JL, Xu J, Jbabdi S, Webster M, Polimeni JR, et al. 2013. The minimal preprocessing pipelines for the human connectome project. NeuroImage. 80:105–124. [DOI] [PMC free article] [PubMed] [Google Scholar]
- Gordon EM, Laumann TO, Adeyemo B, Gilmore AW, Nelson SM, Dosenbach NUF, Petersen SE. 2017a. Individual-specific features of brain systems identified with resting state functional correlations. NeuroImage. 146:918–939. [DOI] [PMC free article] [PubMed] [Google Scholar]
- Gordon EM, Laumann TO, Adeyemo B, Huckins JF, Kelley WM, Petersen SE. 2016. Generation and evaluation of a cortical area parcellation from resting-state correlations. Cereb Cortex. 26:288–303. [DOI] [PMC free article] [PubMed] [Google Scholar]
- Gordon EM, Laumann TO, Adeyemo B, Petersen SE. 2017b. Individual variability of the system-level organization of the human brain. Cereb Cortex. 27:386–399. [DOI] [PMC free article] [PubMed] [Google Scholar]
- Gordon EM, Laumann TO, Gilmore AW, Newbold DJ, Greene DJ, Berg JJ, Ortega M, Hoyt-Drazen C, Gratton C, Sun H, et al. 2017c. Precision functional mapping of individual human brains. Neuron. 95:791–807. [DOI] [PMC free article] [PubMed] [Google Scholar]
- Gordon EM, Laumann TO, Marek S, Raut RV, Gratton C, Newbold DJ, Greene DJ, Coalson RS, Snyder AZ, Schlaggar BL, et al. 2020. Default-mode network streams for coupling to language and control systems. PNAS. 117:17308–17319. [DOI] [PMC free article] [PubMed] [Google Scholar]
- Gratton C, Dworetsky A, Coalson RS, Adeyemo B, Laumann TO, Wig GS, Kong TS, Gratton G, Fabiani M, Barch DM, et al. 2020. Removal of high frequency contamination from motion estimates in single-band fMRI saves data without biasing functional connectivity. NeuroImage. 217:116866. [DOI] [PMC free article] [PubMed] [Google Scholar]
- Gratton C, Laumann TO, Nielsen AN, Greene DJ, Gordon EM, Gilmore AW, Nelson SM, Coalson RS, Snyder AZ, Schlaggar BL, et al. 2018. Functional brain networks are dominated by stable group and individual factors, not cognitive or daily variation. Neuron. 98:439–452. [DOI] [PMC free article] [PubMed] [Google Scholar]
- Greene DJ, Laumann TO, Dubis JW, Ihnen SK, Neta M, Power JD, Pruett JR, Black KJ, Schlaggar BL. 2014. Developmental changes in the organization of functional connections between the basal ganglia and cerebral cortex. J Neurosci. 34:5842–5854. [DOI] [PMC free article] [PubMed] [Google Scholar]
- Greene DJ, Marek S, Gordon EM, Siegel JS, Gratton C, Laumann TO, Gilmore AW, Berg JJ, Nguyen AL, Dierker D, et al. 2020. Integrative and network-specific connectivity of the basal ganglia and thalamus defined in individuals. Neuron. 105:742–758. [DOI] [PMC free article] [PubMed] [Google Scholar]
- Greene DJ, Williams Iii AC, Koller JM, Schlaggar BL, Black KJ, The Tourette Association of America Neuroimaging Consortium . 2017. Brain structure in pediatric Tourette syndrome. Mol Psychiatry. 22:972–980. [DOI] [PMC free article] [PubMed] [Google Scholar]
- Grillner S, Hellgren J, Ménard A, Saitoh K, Wikström MA. 2005. Mechanisms for selection of basic motor programs—roles for the striatum and pallidum. Trends Neurosci. 28:364–370. [DOI] [PubMed] [Google Scholar]
- Haber SN. 2016. Corticostriatal circuitry. Dialogues Clin Neurosci. 18:7–21. [DOI] [PMC free article] [PubMed] [Google Scholar]
- Haber SN. 2003. The primate basal ganglia: parallel and integrative networks. J Chem Neuroanat. Special Issue on the Human Brain—The Structural Basis for understanding Human Brain function and dysfunction. 26:317–330. [DOI] [PubMed] [Google Scholar]
- Haber SN, Kim K-S, Mailly P, Calzavara R. 2006. Reward-related cortical inputs define a large striatal region in primates that interface with associative cortical connections, providing a substrate for incentive-based learning. J Neurosci. 26:8368–8376. [DOI] [PMC free article] [PubMed] [Google Scholar]
- Haber SN, Knutson B. 2010. The reward circuit: linking primate anatomy and human imaging. Neuropsychopharmacology. 35:4–26. [DOI] [PMC free article] [PubMed] [Google Scholar]
- Haber SN, Kunishio K, Mizobuchi M, Lynd-Balta E. 1995. The orbital and medial prefrontal circuit through the primate basal ganglia. J Neurosci. 15:4851–4867. [DOI] [PMC free article] [PubMed] [Google Scholar]
- Hallquist MN, Hwang K, Luna B. 2013. The nuisance of nuisance regression: spectral misspecification in a common approach to resting-state fMRI preprocessing reintroduces noise and obscures functional connectivity. NeuroImage. 82:208–225. [DOI] [PMC free article] [PubMed] [Google Scholar]
- Harrison BJ, Soriano-Mas C, Pujol J, Ortiz H, López-Solà M, Hernández-Ribas R, Deus J, Alonso P, Yücel M, Pantelis C, et al. 2009. Altered corticostriatal functional connectivity in obsessive-compulsive disorder. Arch Gen Psychiatry. 66:1189–1200. [DOI] [PubMed] [Google Scholar]
- Harrison SJ, Bijsterbosch JD, Segerdahl AR, Fitzgibbon SP, Duff E, Smith SM, Woolrich MW. 2020. Modelling subject variability in the spatial and temporal characteristics of functional modes. NeuroImage. 222:117226. [DOI] [PMC free article] [PubMed] [Google Scholar]
- Harrison SJ, Woolrich MW, Robinson EC, Glasser MF, Beckmann CF, Jenkinson M, Smith SM. 2015. Large-scale probabilistic functional modes from resting state fMRI. NeuroImage. 109:217–231. [DOI] [PMC free article] [PubMed] [Google Scholar]
- Jarbo K, Verstynen TD. 2015. Converging structural and functional connectivity of orbitofrontal, dorsolateral prefrontal, and posterior parietal cortex in the human striatum. J Neurosci. 35:3865–3878. [DOI] [PMC free article] [PubMed] [Google Scholar]
- Jeon H-A, Anwander A, Friederici AD. 2014. Functional network mirrored in the prefrontal cortex, caudate nucleus, and thalamus: high-resolution functional imaging and structural connectivity. J Neurosci. 34:9202–9212. [DOI] [PMC free article] [PubMed] [Google Scholar]
- Ji JL, Spronk M, Kulkarni K, Repovš G, Anticevic A, Cole MW. 2019. Mapping the human brain’s cortical-subcortical functional network organization. NeuroImage. 185:35–57. [DOI] [PMC free article] [PubMed] [Google Scholar]
- Klyachko VA, Stevens CF. 2003. Connectivity optimization and the positioning of cortical areas. PNAS. 100:7937–7941. [DOI] [PMC free article] [PubMed] [Google Scholar]
- Koob GF, Volkow ND. 2016. Neurobiology of addiction: a neurocircuitry analysis. Lancet Psychiatry. 3:760–773. [DOI] [PMC free article] [PubMed] [Google Scholar]
- Kunishio K, Haber SN. 1994. Primate cingulostriatal projection: limbic striatal versus sensorimotor striatal input. J Comp Neurol. 350:337–356. [DOI] [PubMed] [Google Scholar]
- Künzle H. 1978. An autoradiographic analysis of the efferent connections from premotor and adjacent prefrontal regions (areas 6 and 9) in Macaca fascicularis. BBE. 15:210–234. [DOI] [PubMed] [Google Scholar]
- Künzle H. 1975. Bilateral projections from precentral motor cortex to the putamen and other parts of the basal ganglia. An autoradiographic study in Macaca fascicularis. Brain Res. 88:195–209. [DOI] [PubMed] [Google Scholar]
- Laumann TO, Gordon EM, Adeyemo B, Snyder AZ, Joo SJ, Chen M-Y, Gilmore AW, McDermott KB, Nelson SM, Dosenbach NUF, et al. 2015. Functional system and areal organization of a highly sampled individual human brain. Neuron. 87:657–670. [DOI] [PMC free article] [PubMed] [Google Scholar]
- Li M, Wang D, Ren J, Langs G, Stoecklein S, Brennan BP, Lu J, Chen H, Liu H. 2019. Performing group-level functional image analyses based on homologous functional regions mapped in individuals. PLoS Biol. 17:e2007032. [DOI] [PMC free article] [PubMed] [Google Scholar]
- Li W, Pozzo-Miller L. 2019. Dysfunction of the corticostriatal pathway in autism spectrum disorders. J Neurosci Res. 98:2130–2147. [DOI] [PMC free article] [PubMed] [Google Scholar]
- Lynch CJ, Power JD, Scult MA, Dubin M, Gunning FM, Liston C. 2020. Rapid precision functional mapping of individuals using multi-echo fMRI. Cell Rep. 33:108540. [DOI] [PMC free article] [PubMed] [Google Scholar]
- Marcus D, Harwell J, Olsen T, Hodge M, Glasser M, Prior F, Jenkinson M, Laumann TO, Curtiss S, Van Essen D. 2011. Informatics and data mining tools and strategies for the human connectome project. Front Neuroinform. 5:4. [DOI] [PMC free article] [PubMed] [Google Scholar]
- Marek S, Siegel JS, Gordon EM, Raut RV, Gratton C, Newbold DJ, Ortega M, Laumann TO, Adeyemo B, Miller DB, et al. 2018. Spatial and temporal organization of the individual human cerebellum. Neuron. 100:977–993. [DOI] [PMC free article] [PubMed] [Google Scholar]
- Marquand AF, Haak KV, Beckmann CF. 2017. Functional corticostriatal connection topographies predict goal directed behaviour in humans. Nat Hum Behav. 1:0146. [DOI] [PMC free article] [PubMed] [Google Scholar]
- Mestres-Missé A, Turner R, Friederici AD. 2012. An anterior–posterior gradient of cognitive control within the dorsomedial striatum. NeuroImage. 62:41–47. [DOI] [PubMed] [Google Scholar]
- Mink JW. 2001. Basal ganglia dysfunction in Tourette’s syndrome: a new hypothesis. Pediatr Neurol. 25:190–198. [DOI] [PubMed] [Google Scholar]
- Morris LS, Kundu P, Dowell N, Mechelmans DJ, Favre P, Irvine MA, Robbins TW, Daw N, Bullmore ET, Harrison NA, et al. 2016. Fronto-striatal organization: defining functional and microstructural substrates of behavioural flexibility. Cortex. What’s your poison? Neurobehavioural consequences of exposure to industrial, agricultural and environmental chemicals. 74:118–133. [DOI] [PMC free article] [PubMed] [Google Scholar]
- Nakano K, Kayahara T, Tsutsumi T, Ushiro H. 2000. Neural circuits and functional organization of the striatum. J Neurol. 247:V1–V15. [DOI] [PubMed] [Google Scholar]
- Ocklenburg S, Beste C, Arning L, Peterburs J, Güntürkün O. 2014. The ontogenesis of language lateralization and its relation to handedness. Neurosci Biobehav Rev. 43:191–198. [DOI] [PubMed] [Google Scholar]
- O’Rawe JF, Ide JS, Leung H-C. 2019. Model testing for distinctive functional connectivity gradients with resting-state fMRI data. NeuroImage. 185:102–110. [DOI] [PubMed] [Google Scholar]
- Parkes L, Fulcher BD, Yücel M, Fornito A. 2017. Transcriptional signatures of connectomic subregions of the human striatum. Genes Brain Behav. 16:647–663. [DOI] [PubMed] [Google Scholar]
- Partiot A, Vérin M, Pillon B, Teixeira-Ferreira C, Agid Y, Dubois B. 1996. Delayed response tasks in basal ganglia lesions in man: further evidence for a striato-frontal cooperation in behavioural adaptation. Neuropsychologia. 34:709–721. [DOI] [PubMed] [Google Scholar]
- Patriat R, Molloy EK, Birn RM. 2015. Using edge voxel information to improve motion regression for rs-fMRI connectivity studies. Brain Connect. 5:582–595. [DOI] [PMC free article] [PubMed] [Google Scholar]
- Peters AJ, Fabre JMJ, Steinmetz NA, Harris KD, Carandini M. 2021. Striatal activity topographically reflects cortical activity. Nature. 591:420–425. [DOI] [PMC free article] [PubMed] [Google Scholar]
- Power JD, Cohen AL, Nelson SM, Wig GS, Barnes KA, Church JA, Vogel AC, Laumann TO, Miezin FM, Schlaggar BL, et al. 2011. Functional network organization of the human brain. Neuron. 72:665–678. [DOI] [PMC free article] [PubMed] [Google Scholar]
- Power JD, Schlaggar BL, Petersen SE. 2015. Recent progress and outstanding issues in motion correction in resting state fMRI. NeuroImage. 105:536–551. [DOI] [PMC free article] [PubMed] [Google Scholar]
- Power JD, Schlaggar BL, Petersen SE. 2014. Studying brain organization via spontaneous fMRI signal. Neuron. 84:681–696. [DOI] [PMC free article] [PubMed] [Google Scholar]
- Raut RV, Snyder AZ, Raichle ME. 2020. Hierarchical dynamics as a macroscopic organizing principle of the human brain. Proc Natl Acad Sci USA. 117:20890–20897. [DOI] [PMC free article] [PubMed] [Google Scholar]
- Robinson EC, Jbabdi S, Glasser MF, Andersson J, Burgess GC, Harms MP, Smith SM, Van Essen DC, Jenkinson M. 2014. MSM: a new flexible framework for multimodal surface matching. NeuroImage. 100:414–426. [DOI] [PMC free article] [PubMed] [Google Scholar]
- Rosvall M, Bergstrom CT. 2008. Maps of random walks on complex networks reveal community structure. PNAS. 105:1118–1123. [DOI] [PMC free article] [PubMed] [Google Scholar]
- Salgado S, Kaplitt MG. 2015. The nucleus accumbens: a comprehensive review. SFN. 93:75–93. [DOI] [PubMed] [Google Scholar]
- Satterthwaite TD, Elliott MA, Gerraty RT, Ruparel K, Loughead J, Calkins ME, Eickhoff SB, Hakonarson H, Gur RC, Gur RE, et al. 2013. An improved framework for confound regression and filtering for control of motion artifact in the preprocessing of resting-state functional connectivity data. NeuroImage. 64:240–256. [DOI] [PMC free article] [PubMed] [Google Scholar]
- Schultz W, Dickinson A. 2000. Neuronal coding of prediction errors. Annu Rev Neurosci. 23:473–500. [DOI] [PubMed] [Google Scholar]
- Schultz W, Tremblay L, Hollerman JR. 1998. Reward prediction in primate basal ganglia and frontal cortex. Neuropharmacology. 37:421–429. [DOI] [PubMed] [Google Scholar]
- Selemon LD, Goldman-Rakic PS. 1988. Common cortical and subcortical targets of the dorsolateral prefrontal and posterior parietal cortices in the rhesus monkey: evidence for a distributed neural network subserving spatially guided behavior. J Neurosci. 8:4049–4068. [DOI] [PMC free article] [PubMed] [Google Scholar]
- Selemon LD, Goldman-Rakic PS. 1985. Longitudinal topography and interdigitation of corticostriatal projections in the rhesus monkey. J Neurosci. 5:776–794. [DOI] [PMC free article] [PubMed] [Google Scholar]
- Simpson EH, Kellendonk C, Kandel E. 2010. A possible role for the striatum in the pathogenesis of the cognitive symptoms of schizophrenia. Neuron. 65:585–596. [DOI] [PMC free article] [PubMed] [Google Scholar]
- Smaers JB, Steele J, Case CR, Cowper A, Amunts K, Zilles K. 2011. Primate prefrontal cortex evolution: human brains are the extreme of a lateralized ape trend. BBE. 77:67–78. [DOI] [PubMed] [Google Scholar]
- Smith SM, Jenkinson M, Woolrich MW, Beckmann CF, Behrens TEJ, Johansen-Berg H, Bannister PR, De Luca M, Drobnjak I, Flitney DE, et al. 2004. Advances in functional and structural MR image analysis and implementation as FSL. NeuroImage. 23:S208–S219. [DOI] [PubMed] [Google Scholar]
- Steele GE, Weller RE. 1993. Subcortical connections of subdivisions of inferior temporal cortex in squirrel monkeys. Vis Neurosci. 10:563–583. [DOI] [PubMed] [Google Scholar]
- Steiner H, Tseng KY. 2010. Handbook of basal ganglia structure and function. London, UK: Academic Press. [Google Scholar]
- Sylvester CM, Yu Q, Srivastava AB, Marek S, Zheng A, Alexopoulos D, Smyser CD, Shimony JS, Ortega M, Dierker DL, et al. 2020. Individual-specific functional connectivity of the amygdala: a substrate for precision psychiatry. PNAS. 117:3808–3818. [DOI] [PMC free article] [PubMed] [Google Scholar]
- Talairach J, Tournoux P. 1988. Co-planar stereotaxic atlas of the human brain. New York: Thieme Medical Publishers, Inc. [Google Scholar]
- Tziortzi AC, Haber SN, Searle GE, Tsoumpas C, Long CJ, Shotbolt P, Douaud G, Jbabdi S, Behrens TEJ, Rabiner EA, et al. 2014. Connectivity-based functional analysis of dopamine release in the striatum using diffusion-weighted mri and positron emission tomography. Cereb Cortex. 24:1165–1177. [DOI] [PMC free article] [PubMed] [Google Scholar]
- Van Essen DC, Glasser MF, Dierker DL, Harwell J, Coalson T. 2012. Parcellations and hemispheric asymmetries of human cerebral cortex analyzed on surface-based atlases. Cereb Cortex. 22:2241–2262. [DOI] [PMC free article] [PubMed] [Google Scholar]
- Van Hoesen GW, Yeterian EH, Lavizzo-Mourey R. 1981. Widespread corticostriate projections from temporal cortex of the rhesus monkey. J Comp Neurol. 199:205–219. [DOI] [PubMed] [Google Scholar]
- Verstynen TD, Badre D, Jarbo K, Schneider W. 2012. Microstructural organizational patterns in the human corticostriatal system. J Neurophysiol. 107:2984–2995. [DOI] [PMC free article] [PubMed] [Google Scholar]
- Vogelsang DA, D’Esposito M. 2018. Is there evidence for a rostral-caudal gradient in fronto-striatal loops and what role does dopamine play? Front Neurosci. 12:242. [DOI] [PMC free article] [PubMed] [Google Scholar]
- Wang D, Buckner RL, Fox MD, Holt DJ, Holmes AJ, Stoecklein S, Langs G, Pan R, Qian T, Li K, et al. 2015. Parcellating cortical functional networks in individuals. Nat Neurosci. 18:1853–1860. [DOI] [PMC free article] [PubMed] [Google Scholar]
- Webster MJ, Bachevalier J, Ungerleider LG. 1993. Subcortical connections of inferior temporal areas TE and TEO in macaque monkeys. J Comp Neurol. 335:73–91. [DOI] [PubMed] [Google Scholar]
- Wig GS, Laumann TO, Petersen SE. 2014. An approach for parcellating human cortical areas using resting-state correlations. NeuroImage. 93:276–291. [DOI] [PMC free article] [PubMed] [Google Scholar]
- Xia X, Fan L, Cheng C, Eickhoff SB, Chen J, Li H, Jiang T. 2017. Multimodal connectivity-based parcellation reveals a shell-core dichotomy of the human nucleus accumbens. Hum Brain Mapp. 38:3878–3898. [DOI] [PMC free article] [PubMed] [Google Scholar]
- Yeo BTT, Krienen FM, Sepulcre J, Sabuncu MR, Lashkari D, Hollinshead M, Roffman JL, Smoller JW, Zöllei L, Polimeni JR, et al. 2011. The organization of the human cerebral cortex estimated by intrinsic functional connectivity. J Neurophysiol. 106:1125–1165. [DOI] [PMC free article] [PubMed] [Google Scholar]
- Yeterian EH, Pandya DN. 1998. Corticostriatal connections of the superior temporal region in rhesus monkeys. J Comp Neurol. 399:384–402. [PubMed] [Google Scholar]
- Yeterian EH, Pandya DN. 1993. Striatal connections of the parietal association cortices in rhesus monkeys. J Comp Neurol. 332:175–197. [DOI] [PubMed] [Google Scholar]
- Yeterian EH, Pandya DN, Tomaiuolo F, Petrides M. 2012. The cortical connectivity of the prefrontal cortex in the monkey brain. Cortex. Frontal lobes. 48:58–81. [DOI] [PMC free article] [PubMed] [Google Scholar]
- Yeterian EH, Van Hoesen GW. 1978. Cortico-striate projections in the rhesus monkey: the organization of certain cortico-caudate connections. Brain Res. 139:43–63. [DOI] [PubMed] [Google Scholar]
- Zeharia N, Hertz U, Flash T, Amedi A. 2015. New whole-body sensory-motor gradients revealed using phase-locked analysis and verified using multivoxel pattern analysis and functional connectivity. J Neurosci. 35:2845–2859. [DOI] [PMC free article] [PubMed] [Google Scholar]
Associated Data
This section collects any data citations, data availability statements, or supplementary materials included in this article.
Supplementary Materials
Data Availability Statement
Data: Raw MRI data from the MSC Dataset, as well as segmented cortical surfaces, preprocessed volumetric and cifti-space RSFC timecourses, and preprocessed task timecourses and contrasts, have been deposited in the Openneuro data repository (https://openneuro.org/datasets/ds000224/versions/1.0.2) under the label “Midnight Scan Club.”
Code: Code to perform all preprocessing and analysis is available at https://github.com/MidnightScanClub.