

Abstract
INTRODUCTION:
Injury compromises our epithelial barriers, leaving them vulnerable to external threats. Organismal survival thus impinges on rapid barrier re-establishment after damage. Immunocompromised individuals and immunodeficient animals have profound defects in epithelial repair. However, the precise mechanisms and consequences of immune-epithelial cross-talk after injury remain incompletely defined.
RATIONALE:
Epithelial repair requires cellular adaptation to the hypoxic wound microenvironment through evolutionarily conserved hypoxia-inducible factors (HIFs). This response has long been thought to depend upon epithelial cell-autonomous sensing of oxygen deprivation and responsiveness through HIFs. However, whether and how supportive microenvironmental signals from immune cells intersect with ancient hypoxia responses during epithelial repair have yet to be explored. To address these questions, we were drawn to the skin, a primary epithelial barrier that is surveilled by immune cells and has evolved sophisticated repair mechanisms.
RESULTS:
Using unbiased profiling of repair-associated lymphocytes, we uncovered the enrichment of heterogeneous populations of type 17 lymphocytes. Homozygous Rorgt-EGFP (GFI-KI) mice deficient in RORγt+ cells exhibited a significant defect in epithelial migration and wound re-epithelialization. After damage, we observed a rapid local expansion of preexisting skin-resident RORγt+ cells that was sufficient to drive repair. Of the myriad wound RORγt+ populations, spatial transcriptomics and functional studies revealed that innate-like γδ T cells directed tissue repair by localizing to the wound front and boosting epithelial migration. These cells dominantly produced IL-17A/F in the wound microenvironment, which signaled directly to epithelia through IL-17RC to induce a migratory program.
Comparative spatial transcriptomics of RORγt+ cell-deficient and wild-type (WT) wound edges revealed differences in HIF1α signaling. WT migrating epithelia had robust nuclear HIF1α activation that was notably missing from RORγt+ cell– and epithelial IL-17RC–deficient (Il17rcEKO) animals. Accordingly, epithelial-specific loss of HIF1α (Hif1aEKO) phenocopied the wound-healing defect of GFP-KI and Il17rcEKO mice. However, in contrast to GFP-KI wounds, recombinant IL-17A was unable to augment repair in Hif1aEKO mice, underscoring the necessity of this transcriptional effector mediating re-epithelialization downstream of IL-17A signaling.
RORγt+ cell–deficient and control animals had comparable levels of wound hypoxia, indicating that the failure of RORγt+ cell–deficient animals to induce HIF1α was independent of oxygen sensing. Instead, IL-17A was sufficient to activate epithelial HIF1α both in vivo and in epithelial organoids. IL-17RC signaling rapidly induced activation of both ERK and AKT, which augmented HIF1α protein and transcript levels, but not stability, through mammalian target of rapamycin (mTOR). Acute hypoxia potently activated epithelial HIF1α in vitro, and this response was further boosted by IL-17A. By contrast, we uncovered a striking loss of mTOR and HIF1α in chronic hypoxia. Exogenous IL-17A rescued mTOR, and consequently HIF1α, under conditions of chronic hypoxia, indicating that IL-17A acts as a second signal to enable cell adaptation to low-oxygen environments.
IL-17A induced a transcriptional and functional program of glycolytic metabolism in epithelia, which was dependent upon mTOR and HIF1α. The IL-17A-HIF1α-dependent program of glycolysis fueled epithelial migration, and pharmacological inhibition of glycolysis impaired wound re-epithelialization.
CONCLUSION:
Our findings upend a long-held view that hypoxia is sufficient to cell-autonomously induce HIF1α-mediated metabolic remodeling. We illustrate that IL-17A supplied by RORγt+ γδ T cells is necessary for optimal HIF1α activation in the wound-edge epithelium. The IL-17A-HIF1α axis directed the metabolic rewiring of damaged epithelium toward a program of glycolysis to fuel migration. HIF1α and glycolysis are drivers of tumor progression and metastasis, raising the possibility that IL-17A or other immune-derived signals could drive these pathways in cancer. IL-17A is also central to the pathology of many autoimmune conditions, including psoriasis and inflammatory bowel disease. Thus, the IL-17A–HIF1α axis unveiled by our study may provide therapeutic opportunities for a range of epithelial inflammatory and metastatic diseases.
Graphical Abstract
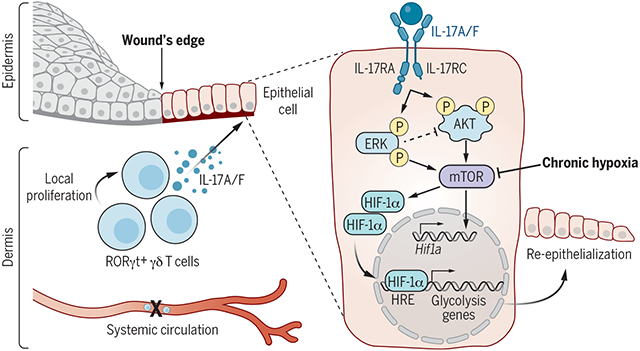
IL-17 drives epithelial HIF1α to fuel wound repair through glycolysis. IL-17A/F supplied by expanding skin-resident RORγt+ γδ T cells is necessary for optimal HIF1α activation in the wound-edge epithelium, even in the presence of hypoxia. IL-17A signaling through the IL-17RC receptor rapidly induces ERK/AKT/mTOR, which augments HIF1α transcripts and protein. The IL-17–HIF1α axis directs a transcriptional and functional program of glycolysis to promote migration.
Mammalian cells autonomously activate hypoxia-inducible transcription factors (HIFs) to ensure survival in low-oxygen environments. We report here that injury-induced hypoxia is insufficient to trigger HIF1α in damaged epithelium. Instead, multimodal single-cell and spatial transcriptomics analyses and functional studies reveal that retinoic acid–related orphan receptor γt+ (RORγt+) γδ T cell–derived interleukin-17A (IL-17A) is necessary and sufficient to activate HIF1α. Protein kinase B (AKT) and extracellular signal–regulated kinase 1/2 (ERK1/2) signaling proximal of IL-17 receptor C (IL-17RC) activates mammalian target of rapamycin (mTOR) and consequently HIF1α. The IL-17A–HIF1α axis drives glycolysis in wound front epithelia. Epithelial-specific loss of IL-17RC, HIF1α, or blockade of glycolysis derails repair. Our findings underscore the coupling of inflammatory, metabolic, and migratory programs to expedite epithelial healing and illuminate the immune cell–derived inputs in cellular adaptation to hypoxic stress during repair.
Epithelial barriers limit the penetration of disease-causing environmental agents. Consequently, organismal survival impinges on the rapid repair and restoration of barrier integrity after injury. Distress signals from wounded microenvironments (i.e., hypoxic, genotoxic, and oxidative stress) evoke ancient cell-intrinsic responses to ensure epithelial cell adaptation to hostile conditions (1). Concomitantly, extrinsic “secondary signals” generated by accessory cells such as growth factors and cytokines direct re-epithelialization of the denuded surface (2). If and how extrinsic microenvironmental signals intersect with primitive cellular stress responses during tissue repair has yet to be explored.
Epithelia are surveilled by an arsenal of lymphocytes that rapidly respond to injury (3). Comprising innate, innate-like, and adaptive lymphocytes, these “first responders” react to alarmins secreted by damaged epithelium (3, 4). Alarmin-induced lymphocyte activation triggers the production of interleukin-17A (IL-17A), IL-17F, and IL-22, cytokines with mitogenic effects that are well documented (5). Epithelial proliferation, however, is dispensable for wound re-epithelialization, a process requiring epithelial cell migration across the breach (6). Thus, defining the migratory programs downstream of lymphocyte–epithelial interactions is of utmost importance.
Mobilized epithelial cells must cope with the harsh wound microenvironment, including low oxygen and nutrient availability, reactive oxygen species, and cellular and microbial debris (2). Precisely how adaptations to these severe conditions occur and whether they are tied to factors emitted by repair-associated lymphocytes is unclear. To tackle this question, we were drawn to the skin epithelium, a primary barrier that has evolved sophisticated repair mechanisms and a prototypic site for lymphocyte-mediated immunosurveillance (7). Using single-cell RNA-sequencing (scRNA-seq) and spatial transcriptomics (8), imaging, and mouse genetic strategies to track communications between lymphocytes and wound edge epithelium (9), we identified retinoic acid–related orphan receptor γt+ (RORγt+) γδ T cell–derived IL-17A as an essential mediator of this dialogue. IL-17A signaling through epithelial IL-17 receptor C (IL-17RC) orchestrates a program of migration and hypoxic adaptation by activating hypoxia-inducible factor 1α (HIF1α). The IL-17A–HIF1α transcriptional axis induces glycolysis, which is necessary for wound re-epithelialization. Thus, we challenge a long-held view that hypoxia is sufficient to cell-autonomously induce HIF1α-mediated metabolic remodeling (10). Moreover, we illuminate the role of microenvironmental signals, such as lymphocyte-derived IL-17A, in facilitating this adaptive tissue response.
Results
Skin-resident RORγt+ cells direct wound re-epithelialization
To define the composition of first responder lymphocytes in an unbiased manner, we performed cellular indexing of transcriptomes and epitopes by sequencing (CITE-seq) (11). CD45+CD90+ lymphocytes were purified and profiled from unwounded skin and at day 3 (D3) and D5 after full-thickness wounding (fig. S1, A and B). Principal component analysis (PCA) and uniform manifold approximation and projection (UMAP) plots with unsupervised analysis of 4923 cells revealed 12 clusters with a clear segregation of effector and regulatory T (Treg) lymphocytes (fig. S1C). Because lymphocytes are notorious for low-abundance transcripts, we used surface protein epitopes alongside transcripts for definitive cluster annotations (fig. S2, A to C). T helper and cytotoxic T (TH/TC) cell clusters 1 to 3, γδ T cell and mucosal-associated invariant T (γδ T/MAIT) cell cluster 1, the natural killer and natural killer T (NK2/NKT) cell cluster, and Treg cell clusters 2 and 3 were enriched in wounded skin compared with unwounded controls (Fig. 1A and fig. S2D). Thus, contrary to expectations, a dominant repair-associated lymphocyte population does not emerge. Rather, many different immune cell populations are substantially remodeled in acute injury.
Fig. 1. Skin-resident RORγt cells direct wound re-epithelialization.

(A) UMAP visualization of individual samples (control, n = 1443 cells; D3, n = 1997 cells; D5, n = 1486 cells). (B) Dot plot of cytokine expression in control and wounded lymphocytes. Shown is the frequency of cells expressing gene (percentage) and average expression per cluster (average). RORγt+ cells (yellow) are enriched at the edge of human (C) (n = 3, N = 1) and murine (D) (n ≥ 4, N = 3) acute wounds. Magenta, keratin (K)14; cyan, DAPI nuclei. White arrows mark RORγt cells. (E) Impaired re-epithelialization in RORγt-deficient (GFP-KI) compared with WT animals. Shown are images and quantifications of integrin α5+ (green), K14+ (red) migrating epidermal tongue from full-thickness silicone-splinted (top) and unsplinted (bottom) D3 wounds. The dashed lines and arrows mark the beginning and end of migrating tongue, respectively. White, EdU; blue, DAPI nuclei; w.b., wound bed (n ≥ 7, N = 3). (F) Wound lymphocytes have a higher frequency (percentage) and expression of proliferation genes (Mki67, Cdk1, and Top2a than control skin. (G) Wound RORγt cells actively proliferate. Shown is an immunofluorescence image of D3 wounded Rorc-EGFPTg mice after a 24-hour EdU pulse. White, EdU; blue, DAPI nuclei; green, RORγt+ cells; red, keratin (K)14 (n = 3, N = 3). (H) FTY720 treatment does not alter wound re-epithelialization (n ≥ 7, N = 3). In (C), (D), and (G), white dashed lines denote dermo-epidermal borders and yellow boxes define magnified areas. Scale bars in (C), (D), and (E), 100 μm; scale bar in (G), 50 μm. Significance was determined using a two-tailed t test and a 95% confidence interval.
We next examined the expression of cytokines that typify type 1, type 2, type 17, and Treg archetypes (12). Of these, the type 17 cytokines Il17a and Il17f and the type 1 cytokine Ifng were enriched in wounded samples (Fig. 1B). Type 17 immunity encompasses different cell types controlled by a master transcription factor RORγt, which has also been implicated in repair (13, 14). Indeed, RORγt+ lymphocytes were enriched in both the human and murine epithelial wound front (Fig. 1, C and D, and fig. S3A). Rorgt-EGFP mice have enhanced green fluorescent protein (EGFP) knocked into the Rorgt locus, rendering it nonfunctional (15). Using homozygous Rorgt-EGFP mice (here-after called GFP-KI), we measured gross wound closure in the absence of RORγt. Both genetic loss of RORγt in GFP-KI mice and topical administration of an RORγt inhibitor, digoxin, resulted in a 40 to 50% reduction in wound closure rate compared with respective controls (fig. S3, B and C) (16).
Human skin heals exclusively by re-epithelialization, a process reliant on epithelial proliferation and subsequent migration into the wound bed. By contrast, mice heal by re-epithelialization and myofibroblast-mediated dermal contraction (17). We therefore secured murine wounds with silicone splints to eliminate dermal contraction. Microscopic visualization revealed a specific impairment of the keratin 14+ (K14+) integrin α5+ migrating epithelial tongue, but not epithelial proliferation, in GFP-KI splinted wounds (Fig. 1E and fig. S3D). Similarly, epithelial migration was markedly compromised in unsplinted GFP-KI wounds relative to controls (Fig. 1E).
Given the rapid enrichment of RORγt lymphocytes in wounds, we postulated that resident RORγt lymphocytes locally expand to fuel repair. Indeed, wound RORγt+ cells had heightened expression of cell-cycle genes (Mki67, Cdk1, and Top2a) and 5-ethynyl-2′-deoxyuridine (EdU) incorporation relative to unwounded skin and to their systemic lymph node counterparts (Fig. 1, F and G, and fig. S3E). To determine whether skin RORγt+ lymphocytes were sufficient to instigate repair, we treated mice with FTY720, a sphingosine-1 phosphate receptor agonist that inhibits lymphocyte egress into blood by “trapping” them within lymph nodes (fig. S3F) (18). FTY720 blockade did not alter the frequency of wound RORγt cells or epithelial migration (Fig. 1H and fig. S3G). Thus, the expansion of preexisting skin RORγt+ cells is sufficient to drive re-epithelialization.
IL-17RC–mediated γδ T cell–epithelial cross-talk controls re-epithelization
We mapped the dynamics of skin RORγt subsets over the course of repair using multi-parameter flow cytometry. Innate-like γδ T cells, MAIT (MR1 tetramer+), and invariant NKT (iNKT) cells (CD1d tetramer+) expanded first at D1 after wounding (fig. S4, A to C). Adaptive TH17, TC17, and RORγt+ Treg cells subsequently increased between D3 and D5. Consistent with our CITE-seq analysis, the proportions of RORγt+ type 3 innate lymphoid cells (ILC3s) were unchanged by injury, suggesting that in the presence of adaptive immunity, ILC3s may not play a dominant role in repair (figs. S2D and S4, A to C).
To pinpoint which RORγt subset(s) was positioned at the re-epithelializing wound front, we turned to spatial transcriptomics (ST), a technology that enables spatially resolved transcriptional profiling of tissues at 50-μm resolution (8) (fig. S5, A to C, and table S4). PCA and UMAP projections distinguished seven clusters (tissue regions) in unwounded skin and six clusters in wounded skin (Fig. 2, A and B). The identified clusters were consistent with histological regions and genes that typified tissue architecture (Fig. 2, A and B, and fig. S5, D and E). Wound-edge epithelium was discernable by Krt14 and Krt17 expression (fig. S6A). Nevertheless, to confirm the identity of epidermal wound edge clusters and validate our ST data, we performed multimodal intersectional analysis (MIA) (8), a method that can infer cell-type enrichment in tissue regions. Integrating an independent scRNA-seq dataset (19), which defined wounded epithelium as growth arrest cells and wound distal epithelium as Col17a1+ cells, with our ST data revealed a significant degree of overlap between Col17a1+ cells and wound distal epithelial cluster 3 (P = 2.3 × 10⁻¹⁶) and growth arrest cells and wound-edge epithelial cluster 4 (P = 5.4 × 10⁻³⁵) (fig. S6, B and C).
Fig. 2. RORγt+ γδT cells drive re-epithelialization through epidermal IL-17RC.

(A) Hematoxylin and eosin–stained tissue image (top) and ST plot of microarray spots (bottom) of unwounded and D3 wounded skin (unwounded, n = 1; wounded, n = 2). Scale bars, 200 μm. (B) UMAP plot and cluster annotation of ST spots based on marker genes in fig. S5. (C) γδ T/MAIT clusters are enriched in wound edge epithelium. P-value score table from MIA of D3 wounded ST clusters and CITE-seq effector lymphocyte clusters. Integrin α5+, K14+ migrating epidermal tongue length in unsplinted D3 wounds from TcrdCreER;Rorcfl/fl and Rorcfl/fl (D) (n ≥ 7, N = 3). Mr1−/− and Mr1Het (E) (n ≥ 4, N = 3). Cd4Cre/−; Rorcfl/fl and Cd4Cre/− (F) (n = 5, N = 3). (G) γδ T/MAIT cell clusters dominantly express Il17a and Il17f. Dot plot of genes from D3 wounded skin CITE-seq analysis. Frequency of cells expressing stated gene (percent) and average expression per cluster (average). (H) rmIL-17A administration augments the re-epithelialization in GFP-KI mice. Experimental schematic (left) and quantification of D3 migrating tongue length of GFP-KI skin intradermally injected with rmIL-17A or PBS (right) (n = 4, N = 2). (I) Spatial plots of Il17rc and Il17ra reveal an up-regulation of these receptors at the wound’s edge. (J) IL-17RC expression on epithelial cells drives re-epithelialization. Quantification of migrating tongue length from splinted D3 wounds Krt14Cre; Il17rcfl/fl mice (n ≥ 5, N = 2). Significance was determined using a two-tailed t test and a 95% confidence interval.
We next leveraged MIA to resolve the location of wound lymphocyte populations identified by our CITE-seq data (Fig. 1A). MIA of the top 300 up-regulated genes (≥0.25 log FC) from each effector lymphocyte CITE-seq cluster and each ST cluster simultaneously located all of our lymphocyte populations in wounded skin and revealed a specific enrichment of γδ T/MAIT cluster 1 (P = 7.9 × 10⁻⁶) and cluster 2 (P = 1.9 × 10⁻⁵) within wound-edge epithelial cluster 4 (Fig. 2C and fig. S6D).
Both γδ T cells and MAIT cells have been implicated in wound repair (20). However, systematic comparisons between these and other RORγt+ cell subsets in the context of re-epithelialization are lacking. We therefore analyzed mice specifically lacking RORγt+ γδ T cells (TcrdCreER;Rorcfl/fl), MAIT cells (Mr1−/−), and TH17/TC17/MAIT/iNKT cells (Cd4Cre;Rorcfl/fl) (fig. S6E). After tamoxifen-induced depletion, TcrdCreER;Rorcfl/fl mice exhibited a shorter migrating tongue than control animals, indicating a nonredundant role for RORγt+ γδ T cells in wound re-epithelialization (Fig. 2D). Wounds from both Mr1−/− and Cd4Cre; Rorcfl/fl mice had migrating tongues comparable to their respective controls, underscoring the unicity of RORγt+ γδ T cells in directing re-epithelialization (Fig. 2, E and F).
RORγt+ γδ T cells exert potent effector function by producing the cytokines IL-17A and IL-17F, which provide instructive signals to the surrounding parenchyma (14, 21). Of all the effector lymphocytes analyzed by CITE-seq, γδ T/MAIT cell clusters expressed the highest level of these cytokines at D3 after wounding, hinting at their role in the RORγt+ γδ T cell–epithelial cross-talk at the wound’s edge (Fig. 2G). Accordingly, intradermal recombinant murine IL-17A (rmIL-17A) administration reversed the re-epithelization defect of GFP-KI mice (Fig. 2H).
IL-17A/F signaling is mediated by an IL-17 receptor A (IL-17RA)–IL-17RC heterodimer, whereas IL-17F can also bind an IL-17RC/RC homodimeric complex (14, 22). ST plots showed increased Il17ra and Il17rc transcripts at the wound’s edge, with the most prominent expression being Il17rc (Fig. 2I). We therefore generated and wounded epithelial-specific IL-17RC–deficient mice (Krt14Cre;Il17rcfl/fl labeled Il17rcEKO) (fig. S6F). Compared with IL-17RC–sufficient mice, epithelial-specific loss of Il17rc mirrored the re-epithelialization defect of GFP-KI and TcrdCreER;Rorcfl/fl mice (Fig. 2J). Thus, IL-17A/F supplied by RORγt+ γδ T cells directly engages epithelial IL-17RC to induce migration and re-epithelialization.
HIF1α is a re-epithelialization factor controlled by RORγt+ cells
PCA and UMAP plots integrating wild-type (WT) and GFP-KI tissue sections from D3 wounds discerned 15 clusters with high reproducibility between biological replicates (Fig. 3, A and B, and fig. S7, A and B). We focused on wound edge clusters 7 and 8 on the basis of histology and expression of the re-epithelialization factors Gjb2, Lamc2, Mmp9, Mmp13, and Stfa1 (fig. S7A). We further delineated cluster 7 as wound-edge basal epithelium (Krt5, Krt6, Krt14, and Krt17) and cluster 8 as wound-edge differentiated epithelium (Krt10, Lce1a1, and Lor). Pathway analysis of WT and GFP-KI cluster 7 differentially expressed genes revealed enrichment of IL-17 signaling, skin/epidermal development, epidermal differentiation, epithelial cell/tissue migration, and T cell activation pathways in WT (Fig. 3C and fig. S8A). HIF1 signaling, which is typically associated with tissue hypoxia, also emerged as a differentially expressed pathway (Fig. 3C) (10), with Hif1a transcripts higher in WT compared with GFP-KI wound edges (Fig. 3D).
Fig. 3. RORγt+ cells control wound edge epithelial HIF1α.

ST spots (A) and UMAP plot (B) of annotated clusters (marker genes in fig. S7) from WT and GFP-KI D3 wounded skin samples (WT, n = 2; GFP-KI, n = 3). (C) KEGG pathways enriched in WT versus GFP-KI cluster 7 spots. (D) Spatial plots of Hif1a expression in D3 WT and GFP-KI wounds. (E) WT migrating tongues have higher HIF1α expression than GFP-KI migrating tongues. Red, top, K14; yellow, top, HIF1α (pseudocolor fire, bottom); cyan, top, DAPI nuclei. Quantification of HIF1α in integrin α5+ cells from GFP-KI and WT D3 wounds (n = 6, N = 3). (F) Quantification of HIF1α in integrin α5+cells from WT and Krt14Cre; Il17rcfl/fl D3 wounds (n = 5, N = 2). (G) Pseudocolor fire view images and quantification of PIM staining in D3 WT and GFP-KI wounds (n = 4, N = 2). (H) Fiber probe measurement of unwounded and D3 wounded tissue oxygen (n ≥ 3, N = 2). (I) Impaired re-epithelialization in epithelial HIF1α-deficient animals (Hif1aEKO) compared with WT. Confocal images and corresponding quantifications of integrin α5+ (yellow), K14+ (red) migrating epidermal tongue from splinted D3 wounds. The dashed line and arrows mark the beginning and end of migrating tongue, respectively. Cyan, DAPI nuclei; w.b., wound bed (n ≥ 5, N = 3). Scale bars in (E), 50 μm; scale bars in (G) and (I), 100 μm. For (E), (G), and (I), two-tailed t test at a 95% confidence interval was used. For (H), one-way ANOVA multiple-comparisons test was used.
To validate this finding, we analyzed the transcriptomes of integrin α5 and integrin α6 double-positive wound-edge epithelium (migrating tongue) and integrin α6+-only wound distal epithelium, from WT and GFP-KI wounds (fig. S8B). We observed very modest differences (62 differentially expressed genes, adjusted P < 0.1) between WT and GFP-KI wound distal epithelium (fig. S8C). By contrast, WT and GFP-KI migrating tongue cells had 1548 differentially expressed transcripts (adjusted P < 0.1) (fig. S8D). HIF1α signaling and associated glycolysis pathways were significantly enriched in WT samples (fig. S8E).
Consistent with the enrichment of Hif1a transcripts, WT migrating epithelial tongue robustly expressed nuclear HIF1α, which was absent from GFP-KI wound fronts (Fig. 3E and fig. S9, A and B). GFP-KI mice did not compensate for the loss of HIF1α by up-regulating HIF2α (fig. S9D). Furthermore, Il17rcEKO mice phenocopied the HIF1α defect observed in GFP-KI wounds (Fig. 3F). Nuclear HIF1α was also robustly expressed in the migrating epithelial front of human wounds, suggesting a highly conserved role for this transcription factor in re-epithelialization (fig. S9C).
HIFs ubiquitously mediate cellular adaptation to low-oxygen environments (23). Therefore, we measured hypoxia in WT and GFP-KI wounds using both a fluorescent hypoxia marker, pimonidazole (PIM), and a fiber probe to directly measure tissue O2. WT and GFP-KI wounds had equivalent PIM signals and O2 levels (~10 to 12 mmHg or 2% O2) (Fig. 3, G and H). Moreover, WT and GFP-KI epithelia expressed comparable levels of prolyl hydroxylases (Egln1, Egln2, and Egln3) and Vhl ubiquitin ligase (fig. S9D). Thus, wound-edge epithelium failed to sustain HIF1α without RORγt+ cell–derived signals even in the presence of tissue hypoxia and while having the necessary regulatory machinery.
We next generated and wounded epithelial-specific HIF1α-deficient mice (Krt14Cre; Hif1afl/fl labeled Hif1aEKO) (fig. S9E). Loss of epithelial HIF1α impaired the development of migrating tongue (Fig. 3I). Additionally, unlike GFP-KI mice, rmIL-17A failed to rescue the re-epithelialization defect of Hif1aEKO mice (Fig. 2H and fig. S9F). Thus, epithelial HIF1α is necessary to respond to IL-17A signals and activate a program of migration.
IL-17RC signaling induces HIF1α through extracellular signal–regulated kinase 1/2 (ERK 1/2)-AKT–mammalian target of rapamycin (mTOR)
To test our hypothesis that γδ T cell–derived IL-17 serves as a second signal to activate HIF1α, we intradermally injected rmIL-17A, rmIL-17F, or rmIL-22 into unwounded skin. Administration of rmIL-17A and, to a lesser degree, rmIL-17F was sufficient to induce epidermal HIF1α activation and hyperplasia (Fig. 4A and fig. S10, A and B). IL-22 marginally increased epidermal thickness but did not up-regulate HIF1α (fig. S10, A and B). Skin epithelial organoids cultured for 5 days in the presence of rmIL-17A were significantly larger than controls and robustly expressed HIF1α (Fig. 4B and fig. S10, C to F). Other damage-associated cytokines [rmIL-1, rmIL-6, and recombinant murine tumor necrosis factor α (rmTNFα)] did not activate HIF1α (fig. S10G). Epidermal growth factor also failed to augment HIF1α to the levels observed after rmIL-17A treatment, underscoring the specificity of IL-17 in amplifying this pathway (fig. S10H).
Fig. 4. IL-17A induces HIF1α through epidermal IL-17RC.

(A) Intradermal injection of rmIL-17A in unwounded skin induces epidermal hyperplasia and HIF1α. Magenta, K14; yellow, HIF1α; cyan, DAPI nuclei (n = 5, N = 3). (B) Epidermal organoids cultured for 6 days at 21% O2, ± rmIL-17A stimulation for 5 days (see experimental schematic in fig. S10C) robustly up-regulate HIF1α. Quantification of HIF1α staining normalized to controls. Red, K14; green, HIF1α; white, phalloidin F actin; blue, DAPI nuclei (n = 3, N = 3). (C) rmIL-17A induced nuclear HIF1α in WT mice but not epidermal IL-17RC–deficient (Il17rcEKO) mice (n = 3, N = 2). Staining and color scheme are the same as in (A). (D) IL-17A–induced HIF1α in organoids is dependent on epidermal IL-17RC (n = 4, N = 2). (E) Epidermal response to rmIL-17A is accompanied by increased phosphorylation of S6 (p-S6Ser240/244, green) (n = 3, N = 2). (F) rmIL-17A–induced p-S6Ser240/244 (green) requires epidermal IL-17RC (n = 3, N = 2). In (E) and (F), blue, DAPI nuclei. In (A) and (C), white asterisks label autofluorescence. In (A) to (C) and (E) and (F), white dashed lines demarcate dermo-epidermal junction or organoid boundaries. Scale bars, 50 μm. For (A) to (C), two-tailed t test at a 95% confidence interval was used. For (D), two-way ANOVA multiple-comparisons test was used.
IL-17RA and IL-7RC were robustly expressed in our epithelial organoids and wound-edge integrin α5+ cells (fig. S10I) (14, 22). Epithelial-specific loss of Il17rc abrogated the ability of rmIL-17A to activate HIF1α both in vivo and in vitro, excluding a role for accessory cells in this cross-talk (Fig. 4, C and D, and fig. S10, J and K). To delineate how epithelial IL-17RC signaling resulted in HIF1α activation, we returned to our comparative GFP-KI and WT wound transcriptomics (Fig. 3, A to C). mTOR signaling, which is implicated in HIF1α regulation, was salient as a key differentially expressed pathway (24, 25). We therefore evaluated ribosomal protein S6S240/244 phosphorylation, a major downstream substrate of mTOR complex 1. rmIL-17A robustly increased epithelial pS6S240/244 in WT but not Il17rcEKO mice and organoids (Fig. 4, E and F, and fig. S10L). rmIL-17A–treated organoids also showed enhanced activation of the upstream kinase phosphorylated S6 kinaseT389 (p-S6KT389) and phosphorylated mTORS2448 (p-mTORS2448) (Fig. 5, A and B). Inhibition of mTOR with rapamycin significantly reduced HIF1α protein downstream of IL-17A (Fig. 5, A to C, and fig. S11, A and B). Additionally, Hif1aEKO and control organoids had comparable sizes and mTOR activation (p-S6S240/244) after rmIL-17A stimulation, confirming that mTOR is upstream of HIF1α (fig. S11, C and D).
Fig. 5. ERK/AKT signaling downstream of IL-17RC controls mTOR and HIF1α.

(A) Experimental schematic of inhibitor treatment in control and rmIL-17A–stimulated organoids. (B) rmIL-17A–treated organoids (D5) have increased pmTORS2448, p-S6KT389, and p-S6S240/244 that is diminished after 12 hours of rapamycin (Rapa) treatment. Vehicle (Veh), N = 2. (C) Rapamycin abrogates rmIL-17A–mediated HIF1α expression in normoxia (21% O2). Quantification of HIF1α staining normalized to controls (n ≥ 5, N = 4). (D) IL-17A up-regulates Hif1a transcripts through mTOR (n = 5, N = 2). (E) Inhibiting AKT (MK-2206) and/or ERK (U0126) for 3 hours blocks rmIL-17A–induced p-S6KT389, p-S6S240/244, and HIF1α (N = 2). (F) IL-17A stimulates p-S6S240/244 and HIF1α in organoids cultured under normoxic or hypoxic (2% O2) conditions (N = 3). (G) Rapamycin abrogates IL-17A–mediated HIF1α expression in hypoxia (n = 4, N = 3). (H) Schematic of proposed mechanism illustrating that AKT and ERK activation proximal of IL-17RC induces mTOR and HIFα. Chronic hypoxia inhibits mTOR and consequently HIF1α. Significance was determined using a two-way ANOVA multiple-comparisons test. In (B), (E), (F), and (G), protein quantifications are relative to the presented internal β-actin controls.
In addition to augmenting HIF1α protein, rmIL-17A stimulation also induced Hif1a gene expression in an mTOR-dependent manner (Fig. 5D). Increased Hif1a transcripts in rmIL-17A–treated organoids were not caused by enhanced mRNA stability, and HIF1α protein was more rapidly degraded in the presence of rmIL-17A (fig. S11, E and F). Thus, mTOR controls HIF1α transcription and protein levels, but not stability, downstream of IL-17A.
To determine whether and how IL-17RC proximal signaling links to mTOR, we next measured early (≤1 hour) mTOR activation after rmIL-17A stimulation and found enrichment of p-S6KT389 and p-S6S240/244 (fig. S11G). Working our way upstream, we detected activation of p-ERK1/2T202/Y204, a canonical mediator of IL-17RC signaling, and protein kinase B (p-AKT S473), an upstream mTOR kinase, after IL-17A stimulation (Fig. 5E). Inhibition of either ERK1/2 (U0126) or AKT (MK-2206) after long- and short-term rmIL-17A treatment (5 days and 30 min, respectively), diminished p-S6KT389, p-S6S240/244, and HIF1α expression (Fig. 5E and fig. S11H). However, blocking ERK also resulted in a compensatory increase in p-AKTS473. Dual inhibition of ERK and AKT ablated the mTOR-HIF1α response downstream of rmIL-17A stimulation (Fig. 5E and fig. S11H). Thus, IL-17RC–proximal AKT and ERK signaling directly activates mTOR and consequently induces HIF1α.
Given the prominence of hypoxia at the wound edge, we next examined the IL-17A–mTOR–HIF1α axis in organoids cultured under acute (5 hours) or chronic (5 days) hypoxic conditions (2% O2). Acute hypoxia was sufficient to stabilize HIF1α, and IL-17A further augmented this response (Fig. 5F). By contrast, and in agreement with our in vivo wounding data, p-S6S240/244 and HIF1α levels were markedly reduced by long-term hypoxic exposure and rescued by the presence of rmIL-17A (Fig. 5F). Rapamycin treatment abrogated the ability of IL-17A to augment HIF1α in chronic hypoxic cultures (Fig. 5G and fig. S11, I and J). Thus, IL-17A directly and potently induces mTOR to up-regulate HIF1α under both normoxic and hypoxic conditions (Fig. 5H).
IL-17A–dependent metabolic reprogramming is vital for re-epithelialization
Migration, a cardinal feature of re-epithelialization, requires cells to expend energy. However, exactly how migrating epithelial cells meet their energy demands in a hypoxic wound microenvironment is unclear (Fig. 3, G and H). Glycolysis and oxidative phosphorylation are the two major cellular energy–producing pathways (26). Of these, HIF1α is known to control a transcriptional program of glycolysis (10). Accordingly, the WT wound front expressed higher levels of glycolysis-associated genes [hexokinase 2 (hk2), phosphoglycerate kinase 1 (Pgk1), and glucose transporter protein 1 (Slc2a1)] than did that of GFP-KI (Fig. 6A).
Fig. 6. IL-17A–HIF1α-mediated metabolic reprograming fuels re-epithelialization.

(A) ST plots of hk2, Pgk1, and Slc2a1 expression in GFP-KI (n = 3) and WT (n = 2) wounds. (B) Increased expression of glycolytic enzymes after rmIL-17A treatment (normalized to control) (n = 6, N = 4). (C) rmIL-17A stimulation results in functional enhancement of glycolysis. Representative ECAR of organoids cultured in the presence or absence of rmIL-17A. There were 22 technical replicates. (D and E) IL-17A–induced expression of glycolytic enzymes is abrogated in rapamycin-treated (D) and Hif1aEKO (E) organoids (n ≥ 5, N = 2). (F and G) pseudocolor fire images and quantifications of glucose transporter 1 staining in D3 WT and Il17rcEKO (n ≥ 5, N = 2) (F) and WT and Hif1aEKO (n ≥ 4, N = 2) (G) migrating tongue. Scale bars, 100 μm. (H) Inhibition of HIF1α (BAY872243) and glycolysis (2-DG) impairs the migration of primary human keratinocytes in the presence and absence of rhIL-17A. Yellow dashed line marks scratch wound edges. Scratched areas were quantified as a percentage relative to the start area at 0 hours (n = 5, N = 3). Scale bars, 500 μm. In (B), (C), (F), and (G), two-tailed t test at a 95% confidence interval was used. In (D) and (E), two-way ANOVA multiple-comparisons test was used. In (H), one-way ANOVA was used.
rmIL-17A treatment significantly increased glucose transporter 1 (Slc2a1) and glycolytic enzyme expression in epithelial organoids (Fig. 6B and fig. S12, A and B). rmIL-17A–treated organoids had heightened glycolysis activity and glycolytic capacity and secreted higher levels of lactate, an end product of glycolysis, compared with controls (Fig. 6C and fig. S12, C and D). Consistent with a role for mTOR in regulating HIF1α, rapamycin-treated or Hif1aEKO organoids expressed lower levels of glycolysis enzymes than did controls (Fig. 6, D and E, and fig. S12, E and F). GKP-KI, Il17rcEKO, and Hif1aEKO wound-edge epithelia expressed significantly lower glucose transporter 1 levels than their respective controls (Fig. 6, F and G, and fig. S12G). rmIL-17A administration rescued glucose transporter 1 levels in GKP-KI wounds (fig. S12H). Thus, the IL-17A–HIF1α axis induces a program of glycolytic metabolism in epithelial cells.
Our findings raised the possibility that the IL-17A–HIF1α–dependent program of glucose metabolism fuels epithelial migration. We topically treated mice with 2-deoxy-d-glucose (2-DG), a glucose analog that inhibits glycolysis. 2-DG–treated mice had significantly shorter integrin α5+ migrating tongues than their control counterparts (fig. S12I). Blocking glycolysis did not alter epithelial cell proliferation, indicating that glycolysis is dispensable for expanding the epithelial cell pool at the wound front (fig. S12J). 2-DG treatment also led to a reduction in wound-edge type 17 cells (fig. S12K). We therefore turned to an in vitro epithelial scratch assay to control for the immune effects of topical 2-DG treatment. 2-DG or HIF1α inhibitor (BAY872243) hindered the ability of human epithelial cells to migrate and seal the in vitro “wound” both in the presence and absence of recombinant human IL-17A (rhIL-17A) (Fig. 6H). Thus, IL-17A augments glycolysis, an essential bioenergetic pathway powering epithelial cell migration, to expedite healing.
Discussion
Collectively, our results illustrate that IL-17A supplied by RORγt+ γδ T cells is necessary for optimal HIF1α activation in the wound-edge epithelium. HIFs are an ancient class of transcription factors that are present in all metazoan cells and are stabilized in response to low microenvironmental oxygen (27). Previous studies attributed the increased expression of HIF1α in injured skin and intestinal epithelium to tissue hypoxia (28, 29). Thus, our discovery that the chronic hypoxic environment of the wound edge is insufficient to activate HIF1α prompts investigation into IL-17, and other secondary activators of HIF1α, in nonhealing wounds and conditions involving chronic hypoxia.
Consistent with published reports, we found that acute hypoxia robustly induces HIF1α (25). By contrast, exposure to chronic hypoxia (reminiscent of the wound microenvironment) leads to a reduction in mTOR and consequently HIF1α. The reasons for down-modulation of mTOR in chronic hypoxia are unclear and warrant further investigation. Nevertheless, IL-17A acts as a “second signal” to activate mTOR in this context through ERK1/2 and AKT kinases. We found that IL-17A–induced mTOR controls HIF1α gene transcription and protein levels but not stability. Thus, our results suggest that adaptation to hypoxia in complex tissue microenvironments requires second signals from accessory cells in addition to cell-autonomous oxygen monitoring.
IL-17A directed the metabolic rewiring of wound-edge epithelium toward a program of glycolysis. In contrast to recent work high-lighting a role for IL-17A–induced glycolysis in fibroblast survival and proliferation, wound-edge epithelia did not require glycolysis to proliferate (21). Instead, this mechanism of energy production was vital for epithelial migration at the wound front. HIF1α and glycolysis are drivers of tumor progression and metastasis, raising the possibility that IL-17A or other immune-derived signals could drive these pathways in cancer (30, 31). IL-17A is also central to the pathology of many autoimmune conditions, including psoriasis, inflammatory bowel disease, and spondyloarthropathies (14). In addition to glycolysis, other HIF1α transcriptional targets may fuel IL-17–mediated epithelial pathologies. Thus, the IL-17A–HIF1α axis that we uncovered here may provide therapeutic opportunities for a wide range of inflammatory and metastatic diseases.
Materials and Methods
Animals
The following mouse strains were purchased from The Jackson Laboratory: C57BL/6J, B6.129P2(Cg)-Rorctm2Litt/J (Rorgt-EGFP), B6N.Cg-Tg(KRT14-cre)1Amc/J, B6.Cg-Il17rctm1.1koll/J, B6.Cg-Tg(Cd4-cre)1Cwi/BfluJ, B6.129S-Tcrdtm1.1(cre/ERT2)Zhu/J, B6(Cg)-Rorctm3Litt/J, B6.129-Hif1atm3Rsjo/J. Mr1tm1(KOMP)Vlcg mice were generated from the KOMP ES cell line Mr1tm1(KOMP)Vlcg, RRID:MMRRC_058774-UCD, obtained from the Mutant Mouse Resource and Research Center (MMRRC) at University of California, Davis. Tg(Rorc-EGFP)1Ebe mice were a gift from Dr. G. Eberl (Institut Pasteur). All animal studies were approved by the institutional animal care and use committee (IACUC). Mice were bred and maintained under specific-pathogen-free conditions at the Association for Assessment and Accreditation of Laboratory Animal Care (AAALAC)–accredited facilities at the New York University Langone Health Center and housed in accordance with the procedures outlined in the National Institutes of Health’s Guide for the Care and Use of Laboratory Animals. Experiments were performed with IACUC-approved protocols. Age- and sex-matched controls were used in all experiments presented.
Human wound samples
Normal and wounded human skin samples were collected from three healthy donors (a 48-year-old female, a 24-year-old female, and a 27-year-old male) at Karolinska University Hospital, Stockholm, Sweden. After local lidocaine injection, two full-thickness excisional wounds were created using a 4-mm biopsy punch at the upper buttock area of each donor. Central excised skin was used as unwounded control. Wound-edge skin was collected using a 6-mm biopsy punch 1 and 7 days later. All donors consented to the collection and use of clinical samples. The study was approved by the Stockholm Regional Ethics Committee and conducted according to the Declaration of Helsinki’s principles.
Skin wound-healing models
Full-thickness wounds
Seven- to 8-week-old mice in the telogen (resting) phase of the hair cycle were used for wounding studies. After hair removal, a 4-mm biopsy punch (Miltex) was used to make full-thickness wounds on dorsal skin. Wound closure was assessed macroscopically with an engineer’s caliper, and the wound-healing area and rate were calculated as previously described (9).
Splinted full-thickness wounds
Four-millimeter full-thickness wounds were stented open by a 10-mm-diameter silicone ring and secured with skin glue and eight simple, interrupted 6-0 sutures. Wounds were dressed immediately after splinting and dressings were changed every other day thereafter. Animals were singly housed to limit disruption to splint.
Skin tissue digest
Unwounded or 0.25 mm of skin around the wound edge was excised and digested in Liberase TL (Sigma-Aldrich) as previously described (9).
Flow cytometry and fluorescence-activated cell sorting (FACS)
Single-cell suspensions were preincubated with anti-CD16/32 before staining with surface fluorescent conjugated antibodies and/or oligo-tagged antibodies (table S1) at predetermined concentrations in a 100 μl of staining buffer [phosphate-buffered saline (PBS) containing 5% fetal bovine serum (FBS) and 1% HEPES] per 107 cells. Stained cells were resuspended in 4′,6-diamidino-2-phenylindole (DAPI) in FACS buffer before purification or analysis. For intracellular staining, fixable Live/Dead dye was added before surface antibody incubation, which was performed according to the manufacturer’s instructions for the Foxp3/Transcription Factor Staining Buffer Set (BD Biosciences). Flow cytometry data were acquired on LSRII Analyzers (BD Biosciences) and then analyzed with FlowJo program. FACS was performed using FACSAria Cell Sorters (BD Biosciences).
Immunofluorescence and image analysis
Tissue was fixed, processed, and stained as previously described (9). EdU reactions were performed according to the manufacturer’s directions (Life Technologies). Migrating tongues were determined by measuring the length of K14+ integrin α5+ cells. The number of wound-edge proliferating epithelial cells was determined by counting EdU+ K14+ cells from the first hair follicle adjacent to the wound until the wound’s leading edge. To detect PIM, slides were pretreated with a mouse-on-mouse immunodetection kit (Vector Laboratories) and then stained with biotin–anti-PIM adduct antibodies per the manufacturer’s guidelines (Hydroxyprobe). ImageJ was used to quantify PIM and glucose transporter 1 integrated density, a well-established method of measuring fluorescence intensity that accounts for differences in the area of the signal in K14+ and integrin α5+ migrating tongue. Images are shown with the pseudocolor Fire from ImageJ after they were contrasted equally and background was uniformly removed.
Epithelial organoids were released from basement membrane matrix (BME) with organoid harvesting solution (Cultrex), fixed in 4% paraformaldehyde for 2 hours at 4°C, and then incubated in acetone at −20°C. Organoids were stained with conditions similar to tissue sections and embedded in agarose for imaging. Data were analyzed using ImageJ. Organoid HIF1α intensity was determined using the Single Target Translocation Assay from HSC studio (Thermo Fisher). For the complete list of immunofluorescence antibodies and concentrations used, see table S2.
Microscopy and image processing
Images were acquired with a Zeiss Axioplan2 using a Plan-Apochromat 20×/0.8 air objective or Zeiss LSM 710 laser scanning confocal microscope using Plan-Apochromat 20×/0.75 air and Plan-Apochromat 63×/1.40 oil objectives. Tiled and stitched images of sagittal sections were collected using a Plan-Apochromat 20×/0.75 air objective, controlled by Zen software (Zeiss).
Organoids were imaged using Cell Insight CX7-LZR (Thermo Scientific), and images were processed with HCS Studio Cell Analysis software (Thermo Scientific). Maximal projection z-stacks are presented, and co-localization was interpreted only in single z-stacks. z-stacks were projected using ImageJ. Images were assembled in Adobe Illustrator CC2015.3.
Animal drug treatments
EdU pulse
Mice were injected intraperitoneally with EdU (50 μg/g) (Thermo Scientific) either 3 hours (epithelial cells) or 24 hours (lymphocytes) before analysis.
FTY720
Mice were intraperitoneally injected with 2 mg/kg of FTY720 or vehicle control for 3 consecutive days before wounding and then throughout the wound repair response. Ten microliters of blood were collected through the jugular vein to test FTY70 treatment efficacy before wound analysis.
Tamoxifen
To activate Cre recombinase, 7- to 8-week-old mice were treated with 7.5 mg of 4-hydroxytamoxifen (Sigma-Aldrich) dissolved in 250 μl of corn oil every other day by oral gavage three times before wounding and continuously during wound repair.
PIM HCl
PIM HCl (hypoxyprobe) was intraperitoneally injected into mice at the dose of 60 mg/kg 2 hours before sacrifice.
Recombinant cytokines
The wound edge was intradermally injected with either rmIL-17A (500 ng in 20 μl of PBS, carrier-free; PeproTech) or PBS control immediately after a 4-mm biopsy. The following cytokine concentrations were used for daily intradermal injections for 7 days in unwounded ear pinnae and compared with the PBS-only vehicle control: IL-17A (500 ng in 20 μl of PBS, carrier-free; PeproTech), IL-17F (1 μg in 20 μl of PBS, carrier-free; PeproTech), or IL-22 (500 ng in 20 μl of PBS, carrier-free; PeproTech).
2-DG
2-DG (40 mg/ml; Cayman Chemical) was first dissolved in PBS and then diluted in a water-based gel. This gel was topically applied to dorsal skin 2 days before wounding and then at the wound perimeter daily until analysis.
CITE-seq
FACS-purified live CD45.2+CD90.2+ TCRVg3− cells from unwounded skin at D3 and D5 after wounding were prelabeled with surface-epitope-marking oligo-tagged antibodies and sample-specific oligo-tagged Totalseq-A antibodies (BioLegend; see table S1). Hashed samples were pooled at a 1:1.5:1 ratio of control: D3:D5 before library preparation (Chromium Single Cell 3′ Library, 10X Genomics) and sequenced on an Illumina HiSeq 4000 as 150-bp paired-end reads. Sequencing results were demultiplexed and converted to FASTQ format using Illumina bcl2fastq software. The Cell Ranger Single-Cell Software Suite was used to perform sample demultiplexing, barcode processing, and single-cell 3′ gene counting. The cDNA insert was aligned to the mm10/GRCm38 reference genome. Only confidently mapped, non–polymerase chain reaction (PCR) duplicates with valid barcodes and unique molecular identifiers (UMIs) were used to generate the gene-barcode matrix. Cell Ranger output was further analyzed in R using the Seurat package (32). Surface epitope oligo sequences were merged with cell transcriptome data by matching the cell barcode IDs.
Sample demultiplexing and quality controls
Further analysis including quality filtering, the identification of highly variable genes, dimensionality reduction, standard unsupervised clustering algorithms, and the discovery of differentially expressed genes was performed using the Seurat R package. Samples were demultiplexed to filter out multiplets (cells mapping to multiple hashtags) and negative cells (cells missing hashtags) with a positive quantile threshold of 0.99 between samples. Individual samples were further processed to remove cells with >20% mitochondrial gene expression. To exclude low-quality cells and remaining multiplets or cells that were extreme outliers, the distribution of total genes per cell was calculated. Then, control parameters were applied to filter out cells with <200 detected genes and >3800 detected genes. After removing unwanted cells from the dataset, we normalized the data by the total expression, multiplied by a scale factor of 10,000, and log-transformed the result.
Cell clustering and annotation for CITE-seq data
Clustering was performed using the Seurat R package. PCA was performed to generate graph-based cell clusters, and the top seven PCs with a resolution of 0.6 were used. This yielded 16 unique cell clusters, which were further plotted on the UMAP. Next, contaminating nonlymphoid clusters were removed: macrophages (Cd74, Fcgr1a, and Mrc1), fibroblasts (Col1a2, Pdgfra, and Thy1), and dendritic cells (Cd74, Cd207, and Itgax). Dendritic epidermal T cells (Cd3ehi, Tcrdhi), which are unique to mice and are not found in human skin, were also excluded. PCA was performed again, and the top seven PCs with a resolution of 0.5 were used to generate a UMAP with 12 unique clusters. Each of these clusters was then defined and labeled for cell types using marker genes obtained by performing differential gene expression analysis between the clusters using Wilcoxon rank sum test with an adjusted P value < 0.1 and natural log (fold-change) >0.25 as cutoff and parallel analysis of surface epitope enrichment. Violin plots of marker genes and surface epitopes in fig. S1 generated using the scanpy and seaborn packages in Python (33).
Spatial transcriptomics
Sample processing
Tissues were embedded in optimal cutting temperature medium and frozen in liquid nitrogen–chilled isopentane within 15 min of harvesting. Ten-micrometer cryosections were mounted onto the ST arrays (10X Genomics Visium) and stored at −80°C until use. Tissue sections were fixed in methanol at −20°C and then stained with hematoxylin and eosin. Bright-field images were taken on a Leica SCN400F slide scanner at 20× resolution. Slides were permeabilized with permeabilization enzyme for 5 min, as determined by the tissue optimization protocol. Polyadenylated RNAs captured on the underlying arrays were resuspended in 1.2 ml of 0.1 N HCl for 5 min and reverse transcribed at 53°C for 45 min, followed by second-strand synthesis at 65°C for 5 min. After library preparation, samples were sequenced on a Novaseq 600 (Illumina)
Spot selection and image alignment
After probe cleavage, fluorescent images were taken on a Hamamatsu NanoZoomer whole-slide fluorescence scanner. Bright-field images of the tissue and fluorescent images were manually aligned with Adobe Photoshop CS6 to identify the array of spots beneath the tissue.
Sequence alignment and annotation
Sequencing output and the histology images were processed using space ranger software (10X Genomics). The space ranger mkfastq function was used for sample demultiplexing and to converting spatial barcodes and reads into FASTQ format. The space ranger count function was used to align reads from FATSQ files to the mouse genome (mm10/GRCm38) and then align the microscopic slide image and transcriptome to generate barcode/UMI counts, feature spot matrices, cluster data, and perform gene-expression analysis.
Clustering analysis of ST data
The data were then further analyzed using the Seurat R package. To account for variance in sequencing depth across tissue spots (biological variance driven by heterogeneity in cell density and transcriptional activity) while controlling for technical artifacts, scTransform was used for normalization of gene expression by spots (34). Dimensionality reduction and clustering of sequencing data were run using the same workflow as CITE-seq. Before clustering analysis, scab regions were filtered out from each ST sample using subset function in the Seurat R package.
For the WT control (unwounded) skin sample, PCA was performed and the top 10 PCs with a resolution of 1 were used to identify spatial clusters. For the WT-wounded D3 skin sample, PCA was performed and the top 20 PCs with a resolution of 1 were used to identify spatial clusters. UMAP dimensionality reduction was performed (Fig. 2B) and then overlaid on a histology image for spatial interpretation (Fig. 2A). Clusters were annotated on the basis of top differentially expressed genes and localization in tissue as revealed by histology. To combine and batch align multiple ST samples, the scTranform pipeline from the Seurat vignette was used. After batch alignment, PCA was performed and the top 18 PCs with resolution of 0.9 were used to identify spatial clusters, followed by UMAP dimensionality reduction (Fig. 3, A and B). The data were normalized using scTransform after batch alignment to regress for replicates, and the number of genes per spot and the spatial feature expression visualizations were performed using the normalized data.
Differential expression analysis for ST data
The markers genes were determined using FindAllMarkers function in Seurat, and the Wilcoxon rank-sum test was used for differential testing. The differential expression analysis between the wounded GFP-KI and wounded WT group was also performed using Wilcoxon rank sum test and a non-batch-transformed spatial assay was used for this test. The results were filtered to only include genes with adjusted P values <0.1 and natural log (fold-change) >0.25 for up-regulated genes. The pathway analysis was performed using the cluster Profiler package in R (35).
Multimodal integration analysis
The significance of the overlap between ST genes and cell type marker genes from CITE-seq and published scRNA-seq data [Gene Expression Omnibus (GEO) accession number GSE142471] were queried using the hypergeometric cumulative distribution, with all genes as the background to compute the P value. All genes were calculated as the number of common genes detected between ST and CITE-seq in raw data.
Low-input bulk-RNA sequencing of wound-edge epithelium
A ring width of 0.25 mm skin around the wound edge from control and Rorc-deficient GFP-KI (two or three mice pooled per group per sequencing run) was excised and digested as described in the skin tissue digest section above. Would-edge epithelium was FACS purified from live Epcam+ cells on the basis of integrin α6 and integrin α5 expression while excluding CD45+ immune cells, CD31+ endothelial cells, and CD117+ melanocytes. Total RNA was extracted from FACS-purified integrin α6+ integrin α5+ (migrating tongue) and integrin α6+ integrin α5− (wound edge) samples using the RNeasy Plus Micro Kit (Life Technologies). Libraries were generated with the SMART-Seq v4 Ultra Low Input RNA Kit for Sequencing and the SMARTer ThruPLEX DNA-Seq Kit (Takara Bio). Libraries were sequenced on Nova 6000 system with 50-bp paired-end reads.
Sequencing results were demultiplexed and converted to FASTQ format using Illumina bcl2fastq software. The reads were trimmed for adapter sequences using trimmomatic (version 0.36) in paired end mode with the minimal read length option set to 35 base pairs, trailing set to 5, and the sliding window set to 4:15. The sequencing reads were aligned to the mouse genome (mm10/GRCm38) using the splice-aware STAR aligner (36). The feature Counts program was used to generate counts for each gene on the basis of how many aligned reads overlap its exons (37). The raw counts were further converted to TPM counts to filter for genes with a minimal TPM value ≥10 before differential expression analysis. The raw gene counts were then subset using these TPM-filtered genes (n = 9412) and used to test for differential expression using negative binomial generalized linear models implemented by the DESeq2 R package (38). Volcano plots of differentially expressed genes (log2-fold change ≥0.25, adjusted P value <0.1) were generated using the Enhanced Volcano package in R. Pathways analysis of differentially expressed and up-regulated genes (log2-fold change ≥0.25, adjusted P value <0.1) was performed using the cluster Profiler package in R with the Gene Ontology (GO) (39) and Kyoto Encyclopedia of Genes and Genomes (KEGG) (40) databases.
In vivo oxygen measurements
Tissue oxygen levels were measured using OxyLite probes (Oxford Optronix). The OxyLite NXpO2 Barer Fiber Sensor with a ~250-μm tip was directly inserted into wounded or healthy skin of an anesthetized mouse to continuously monitor oxygen pressure (pO2) for 15 to 20 min. pO2 levels were recorded and analyzed with a data-acquisition system (LabChart Reader, Chart version 8 for Windows; AD Instruments)
Organoid culture
Epithelial organoids were generated as previously described from the dorsal skin of C56BL/6 mice (ages postnatal days 46 to 50) (41). One day after culturing in normoxia (21% O2) or hypoxia (2% O2), rmIL-17A (500 ng/ml, Peprotech), TNFα (100 ng/ml, Peprotech) (42), IL-1β (100 ng/ml, Peprotech) (43), IL-6 (100 ng/ml, Peprotech) (44), epidermal growth factor (500 ng/ml, Peprotech) (41), or PBS was added to the organoid culture medium and replenished on D3. Organoids were harvested on D6 using a nonenzymatic cultrex organoid harvesting solution (R&D Systems) for downstream analyses. For inhibitor studies, organoids were treated 12 hours before harvest with 60 nM rapamycin (LC Laboratories) (45) and vehicle control or 3 hours with U0126-ERK1/2 inhibitor (10 μM, MedChemExpress) (46) or MK-2206-AKT inhibitor (5 μM, MedChemExpress) (47) and vehicle control. Inhibitor concentrations and time course were chosen on the basis of published studies, efficacy of inhibition, and conditions that minimized organoid cell death in our cultures. For protein stability studies, cycloheximide (50 μg/ml, Cayman Chemical) was added to the culture for 5, 10, and 15 min. For mRNA stability studies, actinomycin D (10 μg/ml, Cayman Chemical) was added to the culture for 2, 5, and 8 hours.
Organoid assays
Quantitative PCR
Total RNA was extracted from organoids using RNeasy Plus Micro Kit, and equal amounts of RNA were reverse-transcribed using the superscript VILO cDNA synthesis kit (Invitrogen). Analytes were normalized using the house-keeping gene Actb. For the complete list of quantitative PCR primers, refer to table S3.
Immunoblot
Organoids were lysed with RIPA buffer [62.5 mM Tris-HCl, pH 6.8, 2% SDS, 25% glycerol, 5% β-mercaptoethanol supplemented with the Halt Protease and Phosphatase Inhibitor Cocktail (Thermo Fisher)] and dissociated by passing through a 30-gauge needle. Organoids cultured in a hypoxia chamber were lysed directly in the wells without releasing with organoid-harvesting solution. After incubation at 100°C for 10 min, protein concentration was measured with the DC Protein Assay Kit (Bio-Rad). XT sample buffer was added to the protein lysate (Bio-Rad) and incubated in 95°C for 5 min before being resolved in SDS–polyacrylamide gel electrophoresis and analyzed with immunoblot. Antibodies used for immunoblots are listed in table S2. Figures present representative immunoblots quantified with ImageJ; integrated density for each band was normalized with internal β-actin.
Seahorse extracellular acidification rate analysis
Extracellular acidification rate (ECAR) measurements were performed using an XFe96 analyzer (Agilent Technologies). Seahorse XFe96 plates (Agilent Technologies) were coated with a 10× dilution of BME in Dulbecco’s modified Eagle’s medium (DMEM; Sigma-Aldrich). IL-17A–treated or control organoids were collected with organoid harvest solution, washed once in DMEM basic medium, resuspended in DMEM basic medium with 2 mM glutamine, and seeded onto the coated plates at 175 μl per well. Respiratory rates were measured in response to sequential injections of glucose (10 mM), oligomycin (2 μM), and 2-DG (50 mM) (all Cayman Chemical). Values were normalized to a total number of cells in organoid culture well using the CyQUANT Cell Proliferation Assay (Thermo Fisher).
Lactate secretion assay
Organoid culture supernatant was harvested and centrifuged at 1000g to pellet debris. Lactate was measured using the colorimetric L-Lactate Assay Kit (Abcam). Values were normalized to a total number of cells in each organoid culture well using the CyQUANT Cell Proliferation Assay (Thermo Fisher).
Human primary keratinocyte scratch assay
Primary human keratinocytes were isolated from the foreskin and then cultured in serum-free Keratinocytes Growth Medium KGM-Gold (Lonza, Basel, Switzerland) supplemented with bovine pituitary extract, human endothelial growth factor, bovine insulin, hydrocortisone, gentamicin-amphotericin B (GA-1000), epinephrine, and transferrin.
For scratch migration assays, keratinocytes were allowed to reach confluency. Cells were pretreated with mitomycin C (8 μg/ml) 2 hours before and with 2-DG (40 mM) and BAY872243 (10 μM) 1 hour before scratch assay. Scratches were created by manual scraping of the cell monolayer with a 1-ml pipette tip. Cells were treated with rhIL-17A (100 ng/ml, Peprotech). The scratch area was imaged at 0 and 24 hours using EVOS (Thermo Fisher) and quantified using ImageJ.
Statistics
Data are presented as mean ± SEM. Group sizes were determined on the basis of the results of preliminary experiments. Mice were assigned at random to groups. Experiments were not performed in a blinded fashion. Statistical significance for each experiment was determined as shown in the figure legends, where n = the number of independent biological replicates (animals, unless noted as cells) per group, and N = the number of independent experimental replicates. Statistical significance of bulk RNA-seq data was calculated using an adjusted P value cutoff <0.1 in the DESeq2 R package. Statistical analyses were performed in Prism (GraphPad), DESeq2, or R. No data points were excluded.
Supplementary Material
ACKNOWLEDGMENTS
We thank D. R. Littman, D. Rosenblum, L. Guenin-Mace, B. G. Neel, and M. R. Phillips for helpful discussions, advice, and/or critical reading of this manuscript. The following core facilities enabled our study: NYULMC High-Performance Computing, Flow Cytometry, Genome Technology Center, Histopathology Core, the Microscopy Laboratory, and Applied Bioinformatics Laboratory.
Funding:
This work was supported by Cancer Center Support Grant P30CA016087 from the Laura and Isaac Perlmutter Cancer Center (core facility subsidies), the National Psoriasis Foundation (Early Career Research Grant to P.K.), a Bernard Levine Postdoctoral Fellowship in Immunology to P.K., the American Association of Immunologists (Intersect Fellowship to Y.X.), the Howard Hughes Medical Institute (HHMI Gilliam Fellowship GT13641 to K.P.M), a Pew Stewert Scholar Award (00034119 to S.N.), and the National Institutes of Health (NIH grants 1K22AI135099-01, 1DP2AR079173-01, and R01-AI168462 to S.N.). S.N. is a NYSCF Robertson Stem Cell Investigator and a Packard Fellow.
Footnotes
Competing interests: S.N. is on the SAB of Seed Inc., is a consultant for BiomX, and receives funding from Takeda Pharmaceuticals. A.T. is a scientific advisor to Intelligencia.ai. The remaining authors declare no competing interests.
Data and materials availability: All data to support the conclusions in this manuscript can be found in the main text or the supplemental materials. Genomic data are publicly available at the GEO (accession number GSE166950). Raw data for in vivo measurements of wound repair and image quantifications from our study may be requested from the corresponding authors.
SUPPLEMENTARY MATERIALS
REFERENCES AND NOTES
- 1.Chovatiya R, Medzhitov R, Stress, inflammation, and defense of homeostasis. Mol. Cell 54, 281–288 (2014). doi: 10.1016/j.molcel.2014.03.030; [DOI] [PMC free article] [PubMed] [Google Scholar]
- 2.Eming SA, Martin P, Tomic-Canic M, Wound repair and regeneration: Mechanisms, signaling, and translation. Sci. Transl. Med 6, 265sr6 (2014). doi: 10.1126/scitranslmed.3009337; [DOI] [PMC free article] [PubMed] [Google Scholar]
- 3.Belkaid Y, Harrison OJ, Homeostatic immunity and the microbiota. Immunity 46, 562–576 (2017). doi: 10.1016/j.immuni.2017.04.008; [DOI] [PMC free article] [PubMed] [Google Scholar]
- 4.Harrison OJ et al. , Commensal-specific T cell plasticity promotes rapid tissue adaptation to injury. Science 363, eaat6280 (2019). doi: 10.1126/science.aat6280; [DOI] [PMC free article] [PubMed] [Google Scholar]
- 5.Naik S, Larsen SB, Cowley CJ, Fuchs E, Two to Tango: Dialog between Immunity and Stem Cells in Health and Disease. Cell 175, 908–920 (2018). doi: 10.1016/j.cell.2018.08.071; [DOI] [PMC free article] [PubMed] [Google Scholar]
- 6.Aragona M et al. , Defining stem cell dynamics and migration during wound healing in mouse skin epidermis. Nat Commun. 8, 14684 (2017). doi: 10.1038/ncomms14684; [DOI] [PMC free article] [PubMed] [Google Scholar]
- 7.Bukhari S, Mertz AF, Naik S, Eavesdropping on the conversation between immune cells and the skin epithelium. Int. Immunol 31, 415–422 (2019). doi: 10.1093/intimm/dxy088; [DOI] [PMC free article] [PubMed] [Google Scholar]
- 8.Moncada R et al. , Integrating microarray-based spatial transcriptomics and single-cell RNA-seq reveals tissue architecture in pancreatic ductal adenocarcinomas. Nat. Biotechnol 38, 333–342 (2020). doi: 10.1038/s41587-019-0392-8; [DOI] [PubMed] [Google Scholar]
- 9.Naik S et al. , Inflammatory memory sensitizes skin epithelial stem cells to tissue damage. Nature 550, 475–480 (2017). doi: 10.1038/nature24271; [DOI] [PMC free article] [PubMed] [Google Scholar]
- 10.Semenza GL, Hypoxia-inducible factors in physiology and medicine. Cell 148, 399–408 (2012). doi: 10.1016/j.cell.2012.01.021; [DOI] [PMC free article] [PubMed] [Google Scholar]
- 11.Stoeckius M et al. , Simultaneous epitope and transcriptome measurement in single cells. Nat. Methods 14, 865–868 (2017). doi: 10.1038/nmeth.4380; [DOI] [PMC free article] [PubMed] [Google Scholar]
- 12.O’Shea JJ, Paul WE, Mechanisms underlying lineage commitment and plasticity of helper CD4+ T cells. Science 327, 1098–1102 (2010). doi: 10.1126/science.1178334; [DOI] [PMC free article] [PubMed] [Google Scholar]
- 13.Eberl G, RORγt, a multitask nuclear receptor at mucosal surfaces. Mucosal Immunol. 10, 27–34 (2017). doi: 10.1038/mi.2016.86; [DOI] [PubMed] [Google Scholar]
- 14.McGeachy MJ, Cua DJ, Gaffen SL, The IL-17 family of cytokines in health and disease. Immunity 50, 892–906 (2019). doi: 10.1016/j.immuni.2019.03.021; [DOI] [PMC free article] [PubMed] [Google Scholar]
- 15.Eberl G et al. , An essential function for the nuclear receptor RORgamma(t) in the generation of fetal lymphoid tissue inducer cells. Nat. Immunol 5, 64–73 (2004). doi: 10.1038/ni1022; [DOI] [PubMed] [Google Scholar]
- 16.Huh JR et al. , Digoxin and its derivatives suppress TH17 cell differentiation by antagonizing RORγt activity. Nature 472, 486–490 (2011). doi: 10.1038/nature09978; [DOI] [PMC free article] [PubMed] [Google Scholar]
- 17.Pastar I et al. , Epithelialization in wound healing: A comprehensive review. Adv. Wound Care 3, 445–464 (2014). doi: 10.1089/wound.2013.0473; [DOI] [PMC free article] [PubMed] [Google Scholar]
- 18.Baeyens A, Fang V, Chen C, Schwab SR, Exit strategies: S1P signaling and T cell migration. Trends Immunol. 36, 778–787 (2015). doi: 10.1016/j.it.2015.10.005; [DOI] [PMC free article] [PubMed] [Google Scholar]
- 19.Haensel D et al. , Defining epidermal basal cell states during skin homeostasis and wound healing using single-cell transcriptomics. Cell Rep. 30, 3932–3947.e6 (2020). doi: 10.1016/j.celrep.2020.02.091; [DOI] [PMC free article] [PubMed] [Google Scholar]
- 20.Constantinides MG et al. , MAIT cells are imprinted by the microbiota in early life and promote tissue repair. Science 366, eaax6624 (2019). doi: 10.1126/science.aax6624; [DOI] [PMC free article] [PubMed] [Google Scholar]
- 21.Majumder S et al. , IL-17 metabolically reprograms activated fibroblastic reticular cells for proliferation and survival. Nat. Immunol 20, 534–545 (2019). doi: 10.1038/s41590-019-0367-4; [DOI] [PMC free article] [PubMed] [Google Scholar]
- 22.Chen X et al. , IL-17R-EGFR axis links wound healing to tumorigenesis in Lrig1+ stem cells. J. Exp. Med 216, 195–214 (2019). doi: 10.1084/jem.20171849; [DOI] [PMC free article] [PubMed] [Google Scholar]
- 23.Majmundar AJ, Wong WJ, Simon MC, Hypoxia-inducible factors and the response to hypoxic stress. Mol. Cell 40, 294–309 (2010). doi: 10.1016/j.molcel.2010.09.022; [DOI] [PMC free article] [PubMed] [Google Scholar]
- 24.Laplante M, Sabatini DM, mTOR signaling in growth control and disease. Cell 149, 274–293 (2012). doi: 10.1016/j.cell.2012.03.017; [DOI] [PMC free article] [PubMed] [Google Scholar]
- 25.Harada H et al. , The Akt/mTOR pathway assures the synthesis of HIF-1alpha protein in a glucose- and reoxygenation-dependent manner in irradiated tumors. J. Biol. Chem 284, 5332–5342 (2009). doi: 10.1074/jbc.M806653200; [DOI] [PubMed] [Google Scholar]
- 26.Zhu J, Thompson CB, Metabolic regulation of cell growth and proliferation. Nat. Rev. Mol. Cell Biol 20, 436–450 (2019). doi: 10.1038/s41580-019-0123-5; [DOI] [PMC free article] [PubMed] [Google Scholar]
- 27.Taylor CT, McElwain JC, Ancient atmospheres and the evolution of oxygen sensing via the hypoxia-inducible factor in metazoans. Physiology 25, 272–279 (2010). doi: 10.1152/physiol.00029.2010; [DOI] [PubMed] [Google Scholar]
- 28.Rezvani HR et al. , Loss of epidermal hypoxia-inducible factor-1α accelerates epidermal aging and affects re-epithelialization in human and mouse. J. Cell Sci 124, 4172–4183 (2011). doi: 10.1242/jcs.082370; [DOI] [PubMed] [Google Scholar]
- 29.Wang Y et al. , Long-term culture captures injury-repair cycles of colonic stem cells. Cell 179, 1144–1159.e15 (2019). doi: 10.1016/j.cell.2019.10.015; [DOI] [PMC free article] [PubMed] [Google Scholar]
- 30.Semenza GL, Targeting HIF-1 for cancer therapy. Nat. Rev. Cancer 3, 721–732 (2003). doi: 10.1038/nrc1187; [DOI] [PubMed] [Google Scholar]
- 31.Shiraishi T et al. , Glycolysis is the primary bioenergetic pathway for cell motility and cytoskeletal remodeling in human prostate and breast cancer cells. Oncotarget 6, 130–143 (2015). doi: 10.18632/oncotarget.2766; [DOI] [PMC free article] [PubMed] [Google Scholar]
- 32.Butler A, Hoffman P, Smibert P, Papalexi E, Satija R, Integrating single-cell transcriptomic data across different conditions, technologies, and species. Nat. Biotechnol 36, 411–420 (2018). doi: 10.1038/nbt.4096; [DOI] [PMC free article] [PubMed] [Google Scholar]
- 33.Wolf FA, Angerer P, Theis FJ, SCANPY: Large-scale single-cell gene expression data analysis. Genome Biol. 19, 15 (2018). doi: 10.1186/s13059-017-1382-0; [DOI] [PMC free article] [PubMed] [Google Scholar]
- 34.Hafemeister C, Satija R, Normalization and variance stabilization of single-cell RNA-seq data using regularized negative binomial regression. Genome Biol. 20, 296 (2019). doi: 10.1186/s13059-019-1874-1; [DOI] [PMC free article] [PubMed] [Google Scholar]
- 35.Yu G, Wang LG, Han Y, He QY, clusterProfiler: An R package for comparing biological themes among gene clusters. OMICS 16, 284–287 (2012). doi: 10.1089/omi.2011.0118; [DOI] [PMC free article] [PubMed] [Google Scholar]
- 36.Dobin A et al. , STAR: Ultrafast universal RNA-seq aligner. Bioinformatics 29, 15–21 (2013). doi: 10.1093/bioinformatics/bts635; [DOI] [PMC free article] [PubMed] [Google Scholar]
- 37.Liao Y, Smyth GK, Shi W, featureCounts: An efficient general purpose program for assigning sequence reads to genomic features. Bioinformatics 30, 923–930 (2014). doi: 10.1093/bioinformatics/btt656; [DOI] [PubMed] [Google Scholar]
- 38.Love MI, Huber W, Anders S, Moderated estimation of fold change and dispersion for RNA-seq data with DESeq2. Genome Biol. 15, 550 (2014). doi: 10.1186/s13059-014-0550-8; [DOI] [PMC free article] [PubMed] [Google Scholar]
- 39.Ashburner M et al. , Gene ontology: Tool for the unification of biology. Nat. Genet 25, 25–29 (2000). doi: 10.1038/75556; [DOI] [PMC free article] [PubMed] [Google Scholar]
- 40.Kanehisa M, Furumichi M, Sato Y, Ishiguro-Watanabe M, Tanabe M, KEGG: Integrating viruses and cellular organisms. Nucleic Acids Res. 49 (D1), D545–D551 (2021). doi: 10.1093/nar/gkaa970; [DOI] [PMC free article] [PubMed] [Google Scholar]
- 41.Boonekamp KE et al. , Long-term expansion and differentiation of adult murine epidermal stem cells in 3D organoid cultures. Proc. Natl. Acad. Sci. U.S.A 116, 14630–14638 (2019). doi: 10.1073/pnas.1715272116; [DOI] [PMC free article] [PubMed] [Google Scholar]
- 42.Grabinger T et al. , Ex vivo culture of intestinal crypt organoids as a model system for assessing cell death induction in intestinal epithelial cells and enteropathy. Cell Death Dis. 5, e1228 (2014). doi: 10.1038/cddis.2014.183; [DOI] [PMC free article] [PubMed] [Google Scholar]
- 43.Farin HF et al. , Paneth cell extrusion and release of antimicrobial products is directly controlled by immune cell-derived IFN-γ. J. Exp. Med 211, 1393–1405 (2014). doi: 10.1084/jem.20130753; [DOI] [PMC free article] [PubMed] [Google Scholar]
- 44.Soutto M et al. , Activation of STAT3 signaling is mediated by TFF1 silencing in gastric neoplasia. Nat. Commun 10, 3039 (2019). doi: 10.1038/s41467-019-11011-4; [DOI] [PMC free article] [PubMed] [Google Scholar]
- 45.Jung KB et al. , Interleukin-2 induces the in vitro maturation of human pluripotent stem cell-derived intestinal organoids. Nat. Commun 9, 3039 (2018). doi: 10.1038/s41467-018-05450-8; [DOI] [PMC free article] [PubMed] [Google Scholar]
- 46.Tsai YH et al. , In vitro patterning of pluripotent stem cell-derived intestine recapitulates in vivo human development. Development 144, 1045–1055 (2017). [DOI] [PMC free article] [PubMed] [Google Scholar]
- 47.Li Y et al. , Induction of expansion and folding in human cerebral organoids. Cell Stem Cell 20, 385–396.e3 (2017). doi: 10.1016/j.stem.2016.11.017; [DOI] [PMC free article] [PubMed] [Google Scholar]
Associated Data
This section collects any data citations, data availability statements, or supplementary materials included in this article.