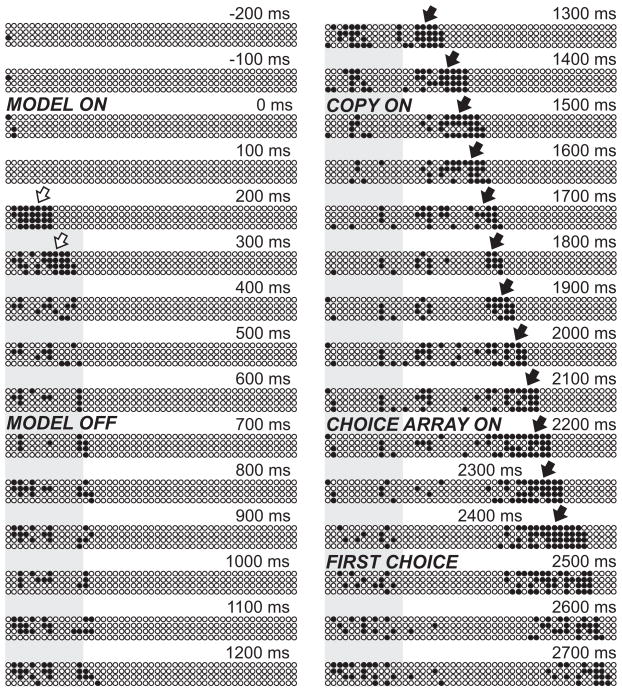
Figure 7.
Parietal cortex represented each value of side (left or right) by activating a sequence of neuronal groups with the same spatial preference in rapid succession (data from shift-copy trials). Filled circles within each grid illustrate the subset of a population of 196 neurons that were significantly engaged to represent object-centered side in a given time bin (time is indicated relative to model onset). Circles are arranged left to right within each grid in order of the time of their first engagement in the trial (the position of neurons within the grid does not reflect their anatomical location). Open arrows indicate neuronal recruitment following presentation of the model object. Filled arrows indicate neuronal recruitment beginning before presentation of the copy object. The vertical gray shading indicates the set of neurons activated during the model period.

